Komodor is a troubleshooting platform for Kubernetes-based environments. It tracks changes and events across the entire system's stack and provides the needed context to troubleshoot issues in our Kubernetes cluster efficiently.
The previous blog post provided a comprehensive overview of the platform and its use. In this blog post, we will see the process of troubleshooting an application with Komodor after setting up our monitoring stack on our Kubernetes cluster. If you would like to follow along, please sign up to Komodor. The introductory blog post guides you through the process.
Introductory blog post: https://anaisurl.com/simplify-troubleshooting/
Introductory video tutorial: https://youtu.be/9eC24tzJxSY
The Plan
I like to provide “real-world” examples to showcase the value of tools such as Komodor. In this scenario, we are going to have our Monitoring Stack with Prometheus, Grafana, and Loki installed on our cluster. Next, we are going to deploy an application and a client.
These two services are going to communicate with each other. The client is going to “ping” our application and the application is going to respond with a “pong”. This will result in a ping-pong communication between both applications.
Next, we are going to update the container image of our application. This deployment will simulate updates to our code “gone wrong”. Our monitoring stack will be used to see that our application is not behaving correctly and get notified of potential errors in the first place. Komodor will be our tool of choice to debug our running application and fix the error.
If you prefer the video tutorial instead of the written guide, you can follow along here:
Setup
We are currently running a Civo Kubernetes cluster. On the cluster, we have several different resources installed, including:
- Our Monitoring Stack with Prometheus and Grafana
- The Komodor Agent
- A Demo Application
Prerequisites
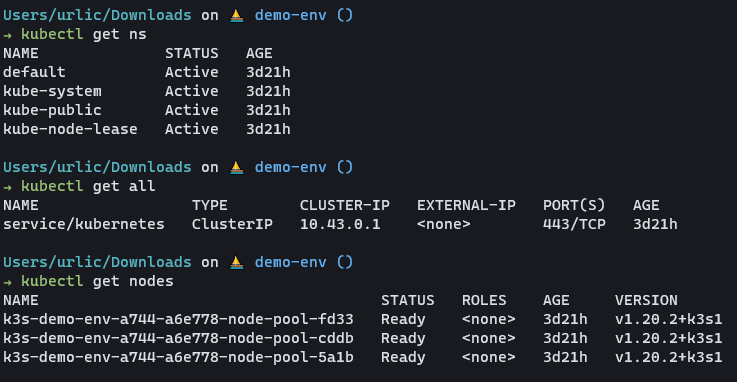
Before we get started, we need a Kubernetes cluster that will host our applications. In our case, we are going to be using Civo Cloud since it is fast and cost-effective. You can find a guide on how to get started with Civo Kubernetes here. However, feel free to use any other Kubernetes cluster instead.
Before heading to the next section, you should be able to connect to your Kubernetes cluster.
Additionally, we are going to use Helm throughout the tutorial to install and update resources running within our cluster. Helm is a Kubernetes package manager (think about it like npm for Kubernetes). Several Kubernetes based tools require lots and lots of YAML manifests. Helm makes it possible to bundle those together into single Helm Charts. If you are completely new to Helm, I highly suggest you to have a look at one of my previous tutorials:
You can install Helm from this link.
Our Monitoring Stack with Prometheus and Grafana
Next, we want to deploy our monitoring stack to our demo cluster. For Prometheus and Grafana, we are going to use the Prometheus stack operator. Please don’t get overwhelmed by the repository, I am going to walk you through all the steps required to set up the operator through the Helm Chart.
First, we have to add the operator repository to our helm cli. Note that the Prometheus stack operator Helm chart is within the prometheus-community repository. No need to get confused by the naming convention.
Follow these commands:
helm repo add prometheus-community https://prometheus-community.github.io/helm-chartsBefore we go ahead and deploy the Helm Chart to our Kubernetes cluster, we want to make a few slight adjustments. These are going to be stored in a values.yaml file.
Create the values.yaml file
touch values.yamlHere is how our values.yaml file will look like:
prometheus:
  prometheusSpec:
    serviceMonitorSelectorNilUsesHelmValues: false
    serviceMonitorSelector: {}
    serviceMonitorNamespaceSelector: {}

grafana:
  sidecar:
    datasources:
      defaultDatasourceEnabled: true
  additionalDataSources:
    - name: Loki
      type: loki
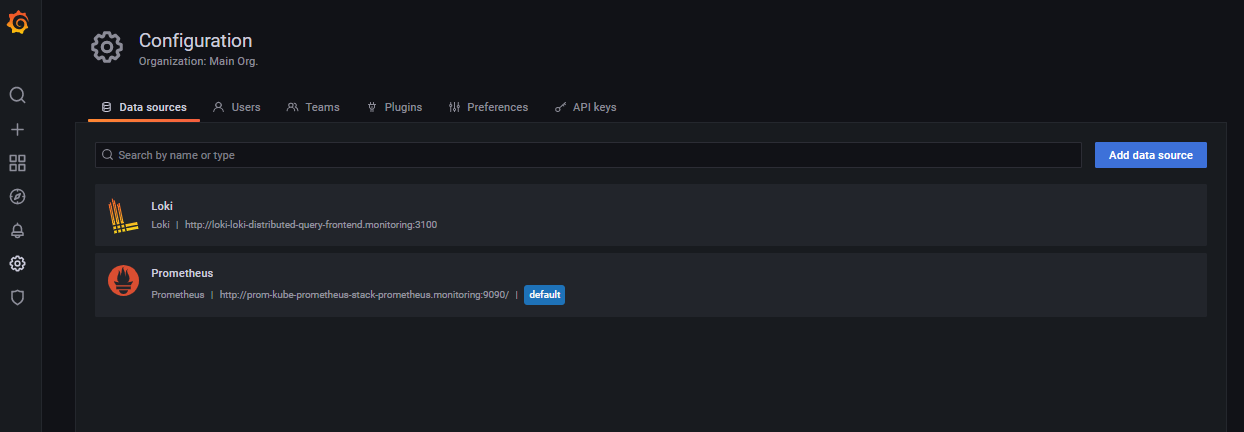
      url: http://loki-loki-distributed-query-frontend.monitoring:3100
What is this content based on?
Within the Prometheus stack operator Helm Chart is a values.yaml file. This file will tell Helm how to configure the Helm Chart upon installation. If we do not overwrite the value within the file, all the default values will get deployed. However, with the default values, we will not be able to connect Prometheus to our application. Thus, we are going to create our own values.yaml file and overwrite some of the values in the default one.
Helm provides a really handy flag to pass in a custom values file through ‘--values’. Note that we are going to install all of our monitoring resources into a monitoring namespace. You can create the namespace through the following command:
kubectl create ns monitoringWe can now run the following command to install the Helm Chart:
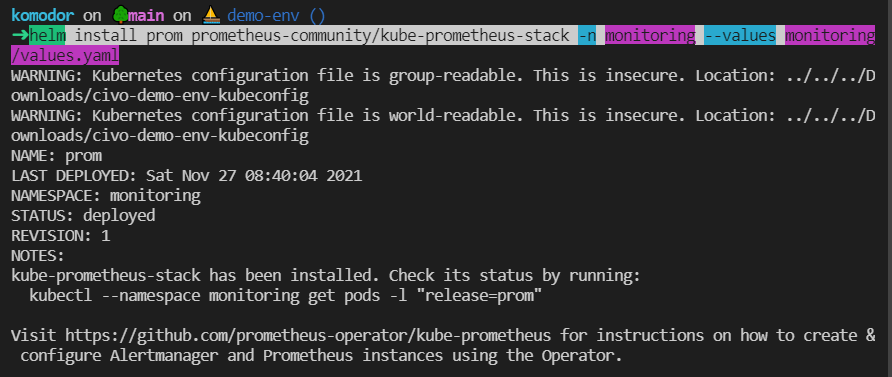
helm install prom prometheus-community/kube-prometheus-stack -n monitoring --values monitoring/values.yamlThe Prometheus stack operator installation will be called ‘prom’ in this case. Feel free to name it whatever you want.
Note that I am running the command from within this git repository. Thus, the ‘values.yaml‘ file is hosted within a ‘monitoring‘ repository. Just make sure that you specify the right path to your values.yaml file.
The output in our terminal should look similar to the following screenshot:
Once the Helm chart has been deployed, we can open the Prometheus UI and the Grafana UI through the following commands:
Prometheus:
kubectl port-forward service/prom-kube-prometheus-stack-prometheus -n monitoring 9090:9090Grafana:
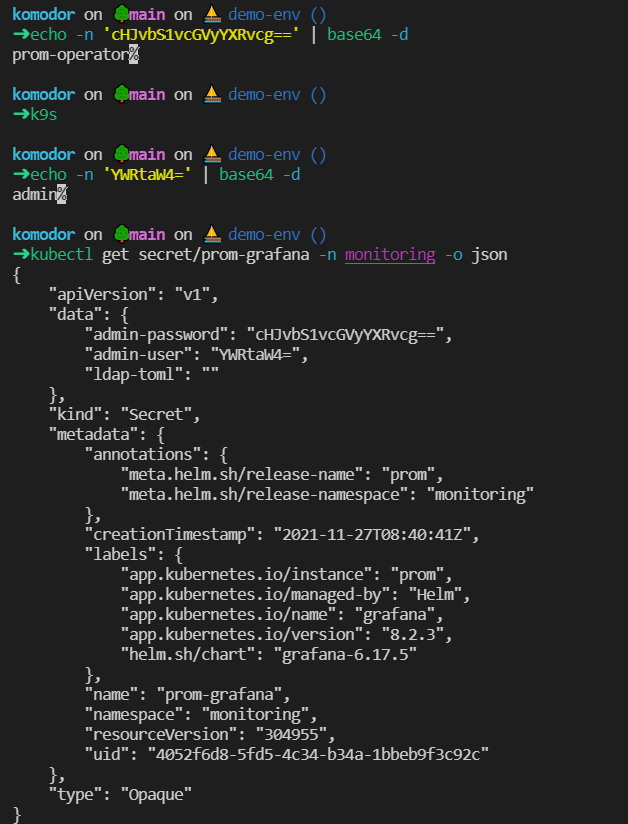
kubectl port-forward service/prom-grafana -n monitoring 3000:80In most cases, you will need the log-in credentials for Grafana; by default, those are going to be:
- Username: admin
- Password: prom-operator
However, you can also look at the secret that got deployed through the Prometheus Operator Helm Chart:
Next, we want to deploy Loki within our cluster. Loki is responsible for gathering logs from our application. In short, Loki is responsible for gathering and managing logs.
First, add the Grafana Helm Charts to your Helm cli:
helm repo add grafana https://grafana.github.io/helm-charts
helm repo update
Next, we can deploy the Promtail and Loki in our cluster. Promtail will require a little bit of custom set-up. Thus, we are going to create a new values file that will host our Promtail configuration. Let’s call it promtail-values.yaml with the following specification:
config:
lokiAddress: "http://loki-loki-distributed-gateway/loki/api/v1/push"
Next, deploy promtail and loki:
helm upgrade --install promtail grafana/promtail -f monitoring/promtail-values.yaml -n monitoring
helm upgrade --install loki grafana/loki-distributed -n monitoring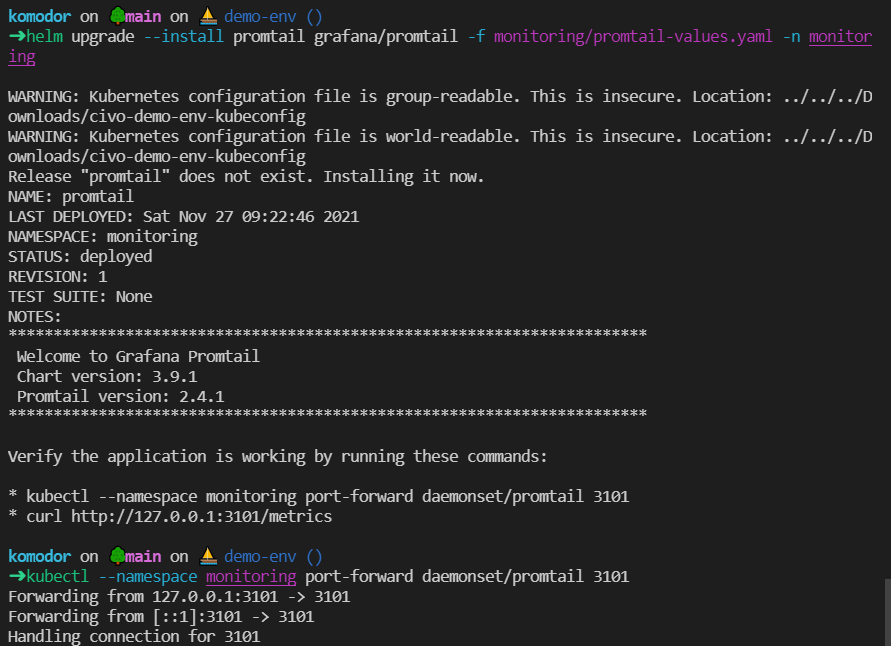
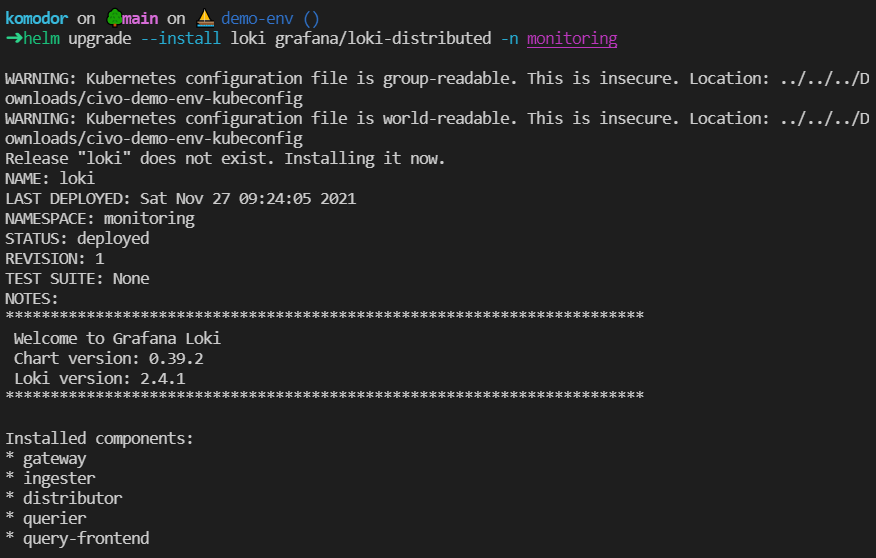
Once the resources are up in the cluster, port-forward Grafana and open the Grafana data-sources. You should see them added:
The Komodor Agent
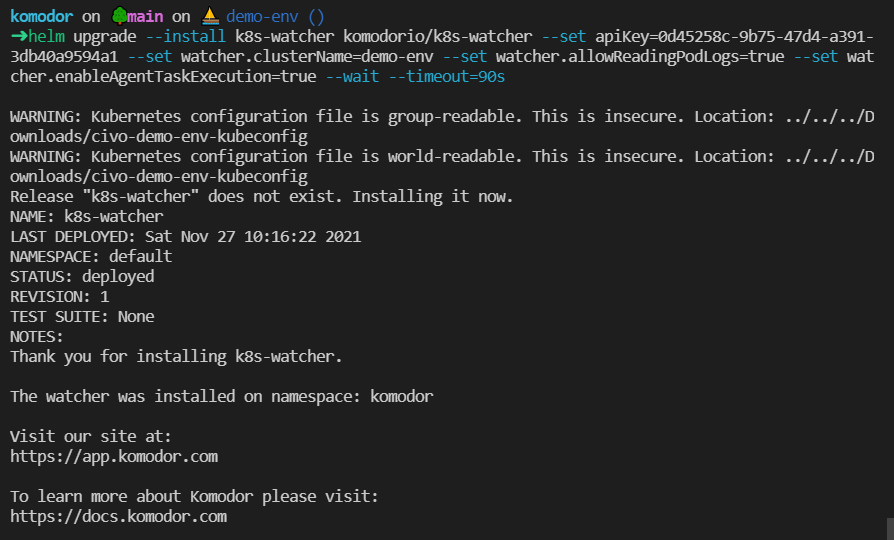
Next, we want to install the Komodor Agent into our cluster. While our monitoring stack will help us to track the behaviour of our workloads, Komodor will track changes to those workloads. The combination of both tools will help us later on to debug our deployments effectively.
helm repo add komodorio https://helm-charts.komodor.io
helm repo update
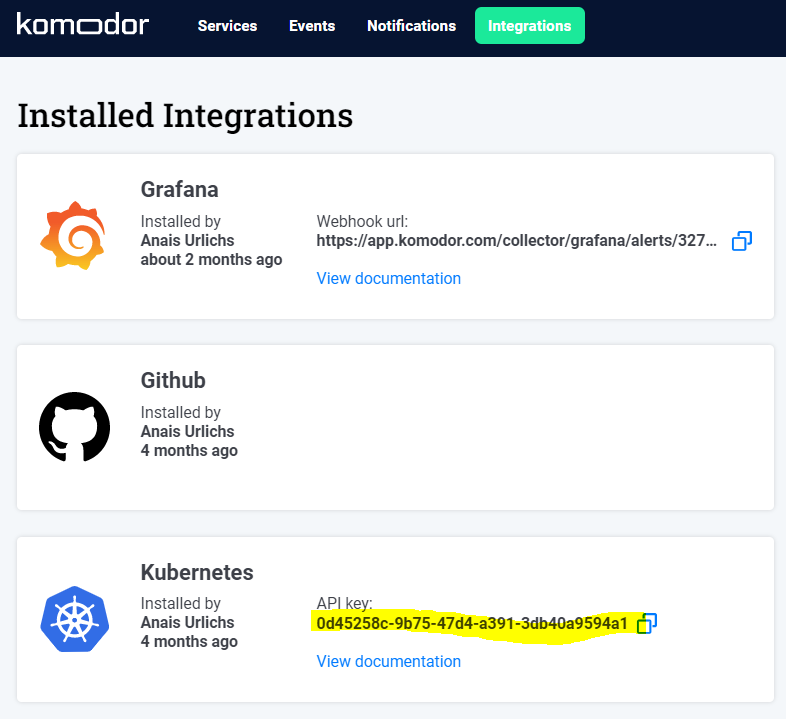
helm upgrade --install k8s-watcher komodorio/k8s-watcher --set apiKey=YOUR_API_KEY_HERE --set watcher.clusterName=CLUSTER_NAME --set watcher.allowReadingPodLogs=true --set watcher.enableAgentTaskExecution=true --wait --timeout=90s
You will be able to find your apiKey in the Komodor UI within the integration section:
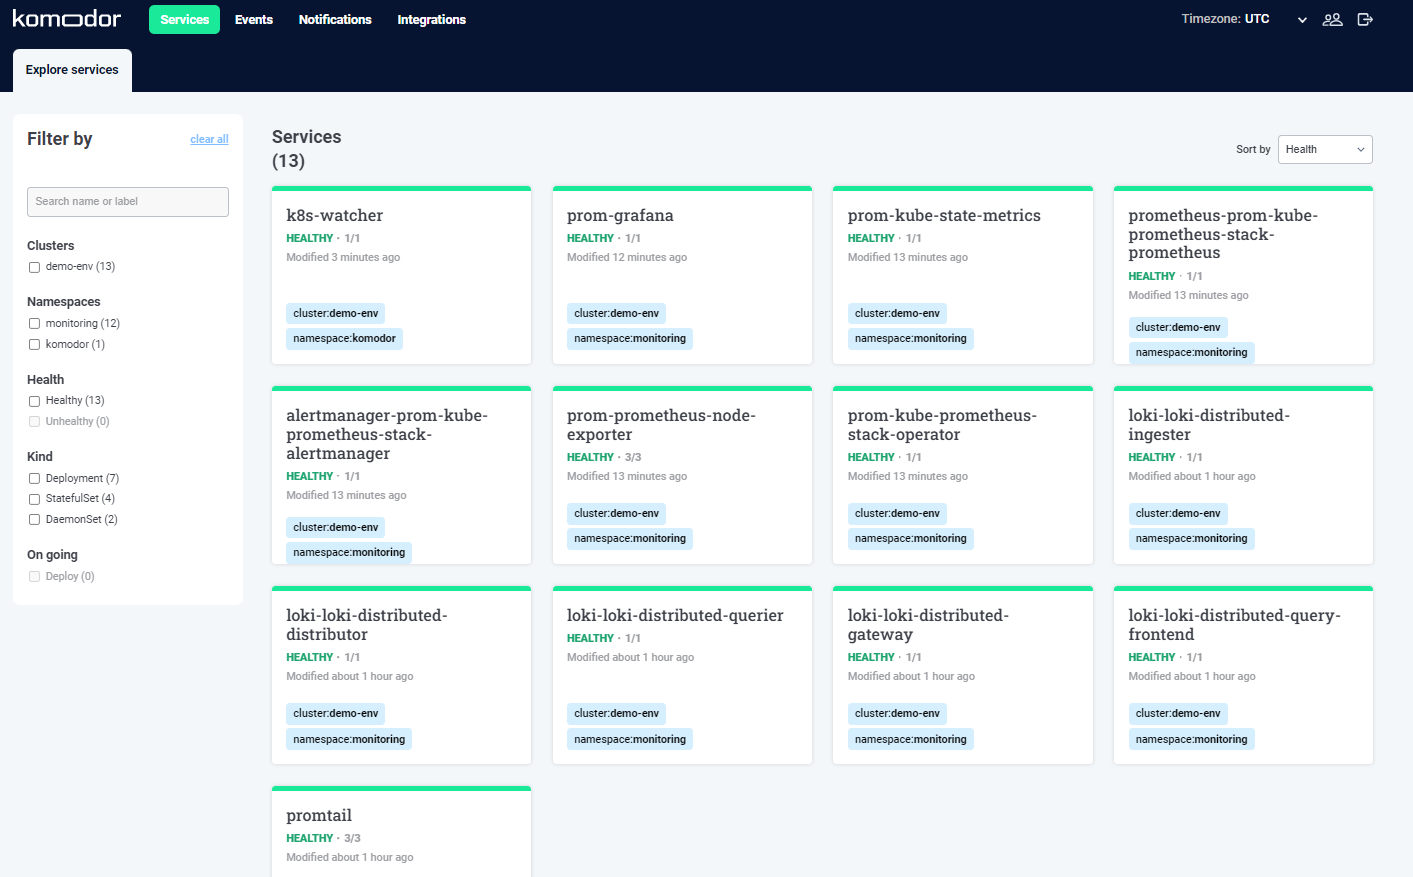
Once our Komodor agent is running inside our cluster, we will be able to see all of our services in the Komodor Dashboard:
From the Integrations section, we will now set up our Komodor-Grafana Integration. The steps are provided in the UI:
A Demo Application
The example application is a simple ping-pong-app, one application pings the other and receives “pong” as a reply.
We want our application to live in a separate namespace. This will make it easier in the long term to separate our workloads and manage our deployments properly.
Create a new namespace:
kubectl create ns demoWithin the namespace, we are going to deploy three resources:
- A deployment.yaml manifest
- A service.yaml manifest
- A servicemonitor.yaml manifest
The servicemonitor is responsible to tell our Prometheus deployment that there is a new application in town that has to be monitored.
Let’s deploy all resources to our cluster:
kubectl apply -f ./application -n demoNow you can port forward our application:
kubectl port-forward service/app -n demo 8080:8080It will not be very exciting but we have to make sure that our application has a metrics endpoint which Prometheus can monitor and through the UI we can already see our metrics:
http://localhost:8080/metrics
Additionally, if you open your Prometheus dashboard, you should now see the new service within targets:
Lastly, we have to deploy the pinger application to the same namespace. The pinger application will ping our pong application.
Run the following command to deploy the pinger:
kubectl apply -f ./pinger -n demoIf you open our application on localhost: http://localhost:8080/ping, you will see a pong response:
Note: Please ignore the trace ID. This example has been taken from another demo that uses Tempo for tracing. We will look at using Tempo in one of my next demos.
Let’s check our deployment in Grafana and Komodor
The deployment of our ping-pong application stack should now be visible both in Grafana and in Komodor.
Grafana
For now, we don’t have a specific Dashboard for our application in Grafana. However, we can run a query in the explore section of the UI.
To calculate the average request duration during the last 5 minutes from a histogram or summary called http_request_duration_seconds, use the following expression:
rate(http_request_duration_seconds_sum[5m])
/
rate(http_request_duration_seconds_count[5m])Feel free to play around with the queries.
Komodor
Within ’Services’, we can see our app and the pinger application:
Taking a look at ’Events’ we can see all the updates that happened to our deployment:
Furthermore, another amazing debugging feature on Komodor is live logs from our deployment.
For this, we are going to click on the Health change of our pinger app. We can then see the YAML manifest that was used to deploy the pinger, additional events recorded in the cluster, as well as the live logs from the pod:
Note that the errors likely come from not having Tempo set up and connected. It’s ok, we will fix it in another tutorial.
Upps, something goes wrong
We are now going to deploy a new version of our application. For the purpose of this tutorial, we are going to name it slow.
kubectl -n demo set image deployment/app app=anaisurlichs/ping-pong:slowOnce the image has been updated, we can see the latency of our application increase in the Grafana Dashboard (based on our previous query):
Now imagine that you have alerts set up in Grafana that tell you whenever your application takes a long time to reply to requests. You don’t have more information beyond the alerts. Where do you start to debug your application?
With Komodor installed, this is pretty straightforward. Once we know from the alerts or our Grafana Dashboard when i.e. at what time our application became slow, we can head over to the Komodor Dashboard and see what changed with our application.
As we can see, a new deployment was rolled out of our application.
This has likely been the cause for our alert/the high latency that we experienced from our application.
We now have a reason to look at the latest deployment and correct anything that might have caused the high latency.
Lastly, we are rolling out a new deployment:
kubectl -n demo set image deployment/app app=anaisurlichs/ping-pong:bestNow we can see that the latency of our application has recovered.
What’s Next?
In this blog post, we saw how we can set up our entire monitoring stack with the Prometheus Stack Operator Helm Chart. This included Prometheus and Grafana. To make our stack complete, we then deployed Loki with Promtail and the Komodor Agent. With every tool, we showcased how you can access its UI and get started using it. Lastly, we gave a demo example to show how you would use both your monitoring tools and Komodor to debug your deployment.
For more information, have a look at the resources provided by Komodor. They have great content on their blog and comprehensive, on-demand webinars.
I hope to see you in my next tutorials!
