Forwarding Security Metrics to Slack with Prometheus and AlertManager
This tutorial will showcase how to install the kube-prometheus-stack Operator Helm Chart and configure AlertManager to send notifications to Slack when
- The Trivy-Operator pod dies or is unhealthy
- Trivy detects a new Critical Vulnerability in a specific namespace
First, we will install the kube-prometheus-operator Helm Chart with the configuration for Prometheus and AlertManager to forward alerts to Slack.
A general understanding of Prometheus would be beneficial in following this tutorial. You can watch another one of my tutorials below to get started. Further resources are listed at the end of this tutorial.
Overview AlertManager
AlertManager comes installed as part of the Prometheus Operator Helm Chart. Generally, Prometheus acts as the “Alert Generator”, and AlertManager is the “Alert Receiver”. This means that we tell Prometheus which alerts to track. Once these alerts are triggered, it will forward the information of the alert to AlertManager and tell AlertManager, “Hey, make sure the user knows these alerts are firing.”
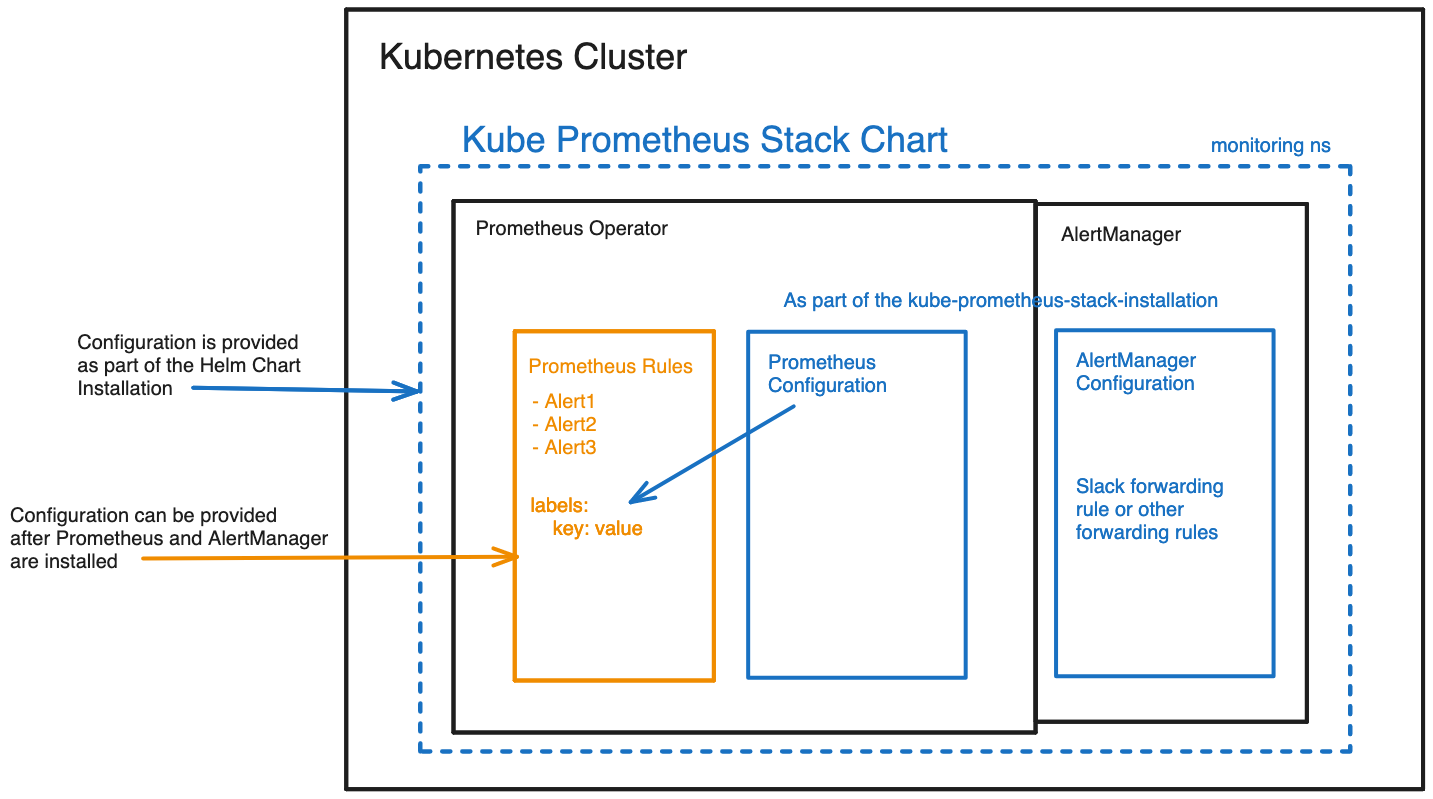
The following graphic details the relationship between Prometheus, PrometheusRules configuration and AlertManager. Everything that is detailed in blue will be installed alongside the kube-prometheus-stack Operator Helm Chart. However, the yellow part shows the additional configuration for the PrometheusRules that will be installed afterwards.
Prerequisites
To follow this tutorial, you will need
- Helm CLI installed locally
- Kubectl installed locally
- A running Kubernetes cluster, this may be a KinD Kubernetes cluster
Lastly, the tutorial will be based on the following GitHub repository. You can access the files in the configuration separately through the links in this tutorial or by cloning the GitHub repository.
git clone git@github.com:Cloud-Native-Security/monitor-security.git
cd monitor-security
Installing Prometheus and AlertManager
Create a monitoring namespace for all related projects:
kubectl create ns monitoringNext, install the Prometheus-Stack-Helm Chart with the following commands:
1st Add the Helm Chart to your Helm Repository Chart list:
helm repo add prometheus-community https://prometheus-community.github.io/helm-charts2nd Update the Helm Charts you have locally. This is usually done to avoid any errors:
helm repo update3rd If you have not cloned the repository shared in the Prerequisite section, then create a values.yaml manifest for the kube-prometheus-stack Operator Helm Chart. Add the content from the following file.
Important: You will need to modify the Slack URL for the webhook. For information on how to access the URL/generate the URL for a specific Slack Channel, follow this guide and the Slack documentation page.
We will look at the configuration in detail in the next section.
4th Install the Helm Chart:
helm upgrade --install prom prometheus-community/kube-prometheus-stack -n monitoring --values observability-conf/prom-values.yamlThis will install AlertManager automatically as part of the Helm Chart installation.
Before we set up the alerts for our security metrics, we will install the Trivy Operator into our cluster for continuous security scanning and generating security-related metrics.
In case you have problems deleting and reinstalling the Helm Chart with AlertManager and AlertManager does not show up
Note that I ran into the issue where I deleted the Helm Chart and then tried to reinstall the Helm Chart. However, uninstalling the Helm Chart does not remove all the resources managed by the Helm Chart. One of the AlertManager secrets is stuck and will prevent AlertManager from being installed the next time that you install the Prometheus Operator Helm Chart. Make sure to
- Query your in cluster secrets
- Delete the AlertManager secrets that are stuck inside your cluster
Afterwards, the kube-prometheus-stack Helm Chart should be easy to reinstall.
kube-promehteus-stack configuration explained
This section explains the configuration for installing the `kube-prometheus-stack` Operator Helm Chart. The `values.yaml` manifest can be found here.
First section:
prometheus:
 prometheusSpec:
   serviceMonitorSelectorNilUsesHelmValues: false
   serviceMonitorSelector: {}
   serviceMonitorNamespaceSelector: {}
   ruleSelector:
      matchExpressions:
       - key: prometheus
         operator: In
         values:
         - example-rules
Only if the serviceMonitorSelectorNilUsesHelmValues is set to false is Prometheus able to access all the ServiceMonitors across the Kubernetes cluster.
The ruleSelector specifies how Prometheus knows about new PrometheusRules inside the cluster. The key “Prometheus” refers to the label key in the Kubernetes metadata of the PromehteusRules, and the values refer to the values of the “Prometheus” label key. So, every PrometheusRule needs to have the following information so that Prometheus can discover the PrometheusRule:
metadata:
 labels:
   prometheus: example-rules
Second Section:
grafana:
 sidecar:
   datasources:
     defaultDatasourceEnabled: true
 additionalDataSources:
   - name: Loki
     type: loki
     url: http://loki-loki-distributed-query-frontend.monitoring:3100
If you do not intend to use Grafana and/or Loki then you can leave this section and the “additionalDataSources” section out.
Third Section:
alertmanager:
 config:
   global:
     resolve_timeout: 5m
     slack_api_url: "https://hooks.slack.com/services/XXXXXXXXXXX"
   route:
     group_by: ['job']
     group_wait: 30s
     group_interval: 5m
     repeat_interval: 12h
     receiver: 'slack'
     routes:
     - match:
         alertname: DeadMansSwitch
       receiver: 'null'
     - match:
       receiver: 'slack'
       continue: true
   receivers:
   - name: 'null'
   - name: 'slack'
     slack_configs:
     - channel: '#alerts'
       send_resolved: true
       title: '[{{ .Status | toUpper }}{{ if eq .Status "firing" }}:{{ .Alerts.Firing | len }}{{ end }}] Monitoring Event Notification'
       text: >-
         {{ range .Alerts }}
           *Alert:* {{ .Annotations.summary }} - `{{ .Labels.severity }}`
           *Description:* {{ .Annotations.description }}
           *Graph:* <{{ .GeneratorURL }}|:chart_with_upwards_trend:> *Runbook:* <{{ .Annotations.runbook }}|:spiral_note_pad:>
           *Details:*
           {{ range .Labels.SortedPairs }} • *{{ .Name }}:* `{{ .Value }}`
           {{ end }}
         {{ end }}
This is the most important section for this tutorial. The main thing you must replace is the slack_api_url with your one Slack URL as detailed before.
Each key in this section is further explained in the AlertManager documentation and the values.yaml manifest in the source kube-prometheus-stack Operator Helm Chart.
Installing the Trivy Operator
The Trivy Operator runs the Trivy security scanner in a Kubernetes native way within our cluster for continuous security scans of our running resources. For more details on the Trivy Operator, check out the documentation.
Install Trivy operator:
helm repo add aqua https://aquasecurity.github.io/helm-charts/
helm repo update
And finally, the Helm chart can be installed with the following command:
helm upgrade --install trivy-operator aqua/trivy-operator --namespace trivy-system --create-namespace --set="trivy.ignoreUnfixed=true" --set="serviceMonitor.enabled=true" --version 0.19.1Quick Check
Ensure that both Prometheus and Trivy Operator are installed correctly.
Trivy:
kubectl get all -n trivy-system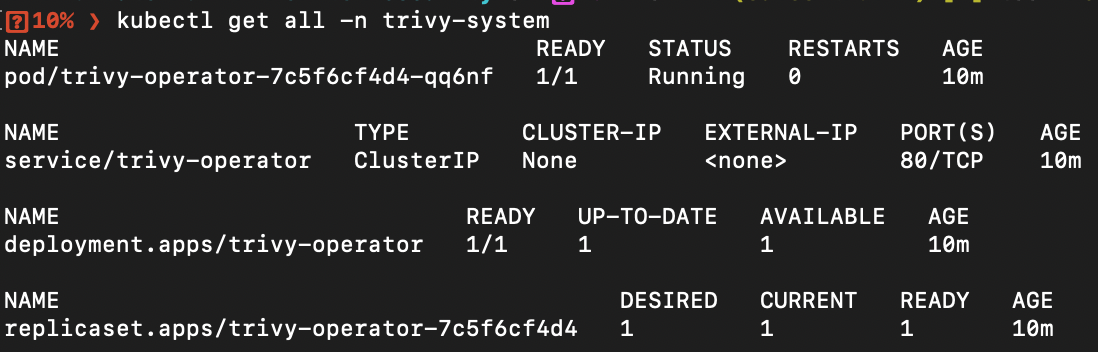
Prometheus operator:
kubectl get all -n monitoringConfiguring AlertManager
Before we know what we want to be alerted on, we should look at our metrics from the Trivy Operator.
To do so, in a new tap and connected to your Kubernetes cluster, port-forward to the Trivy Operator Service:
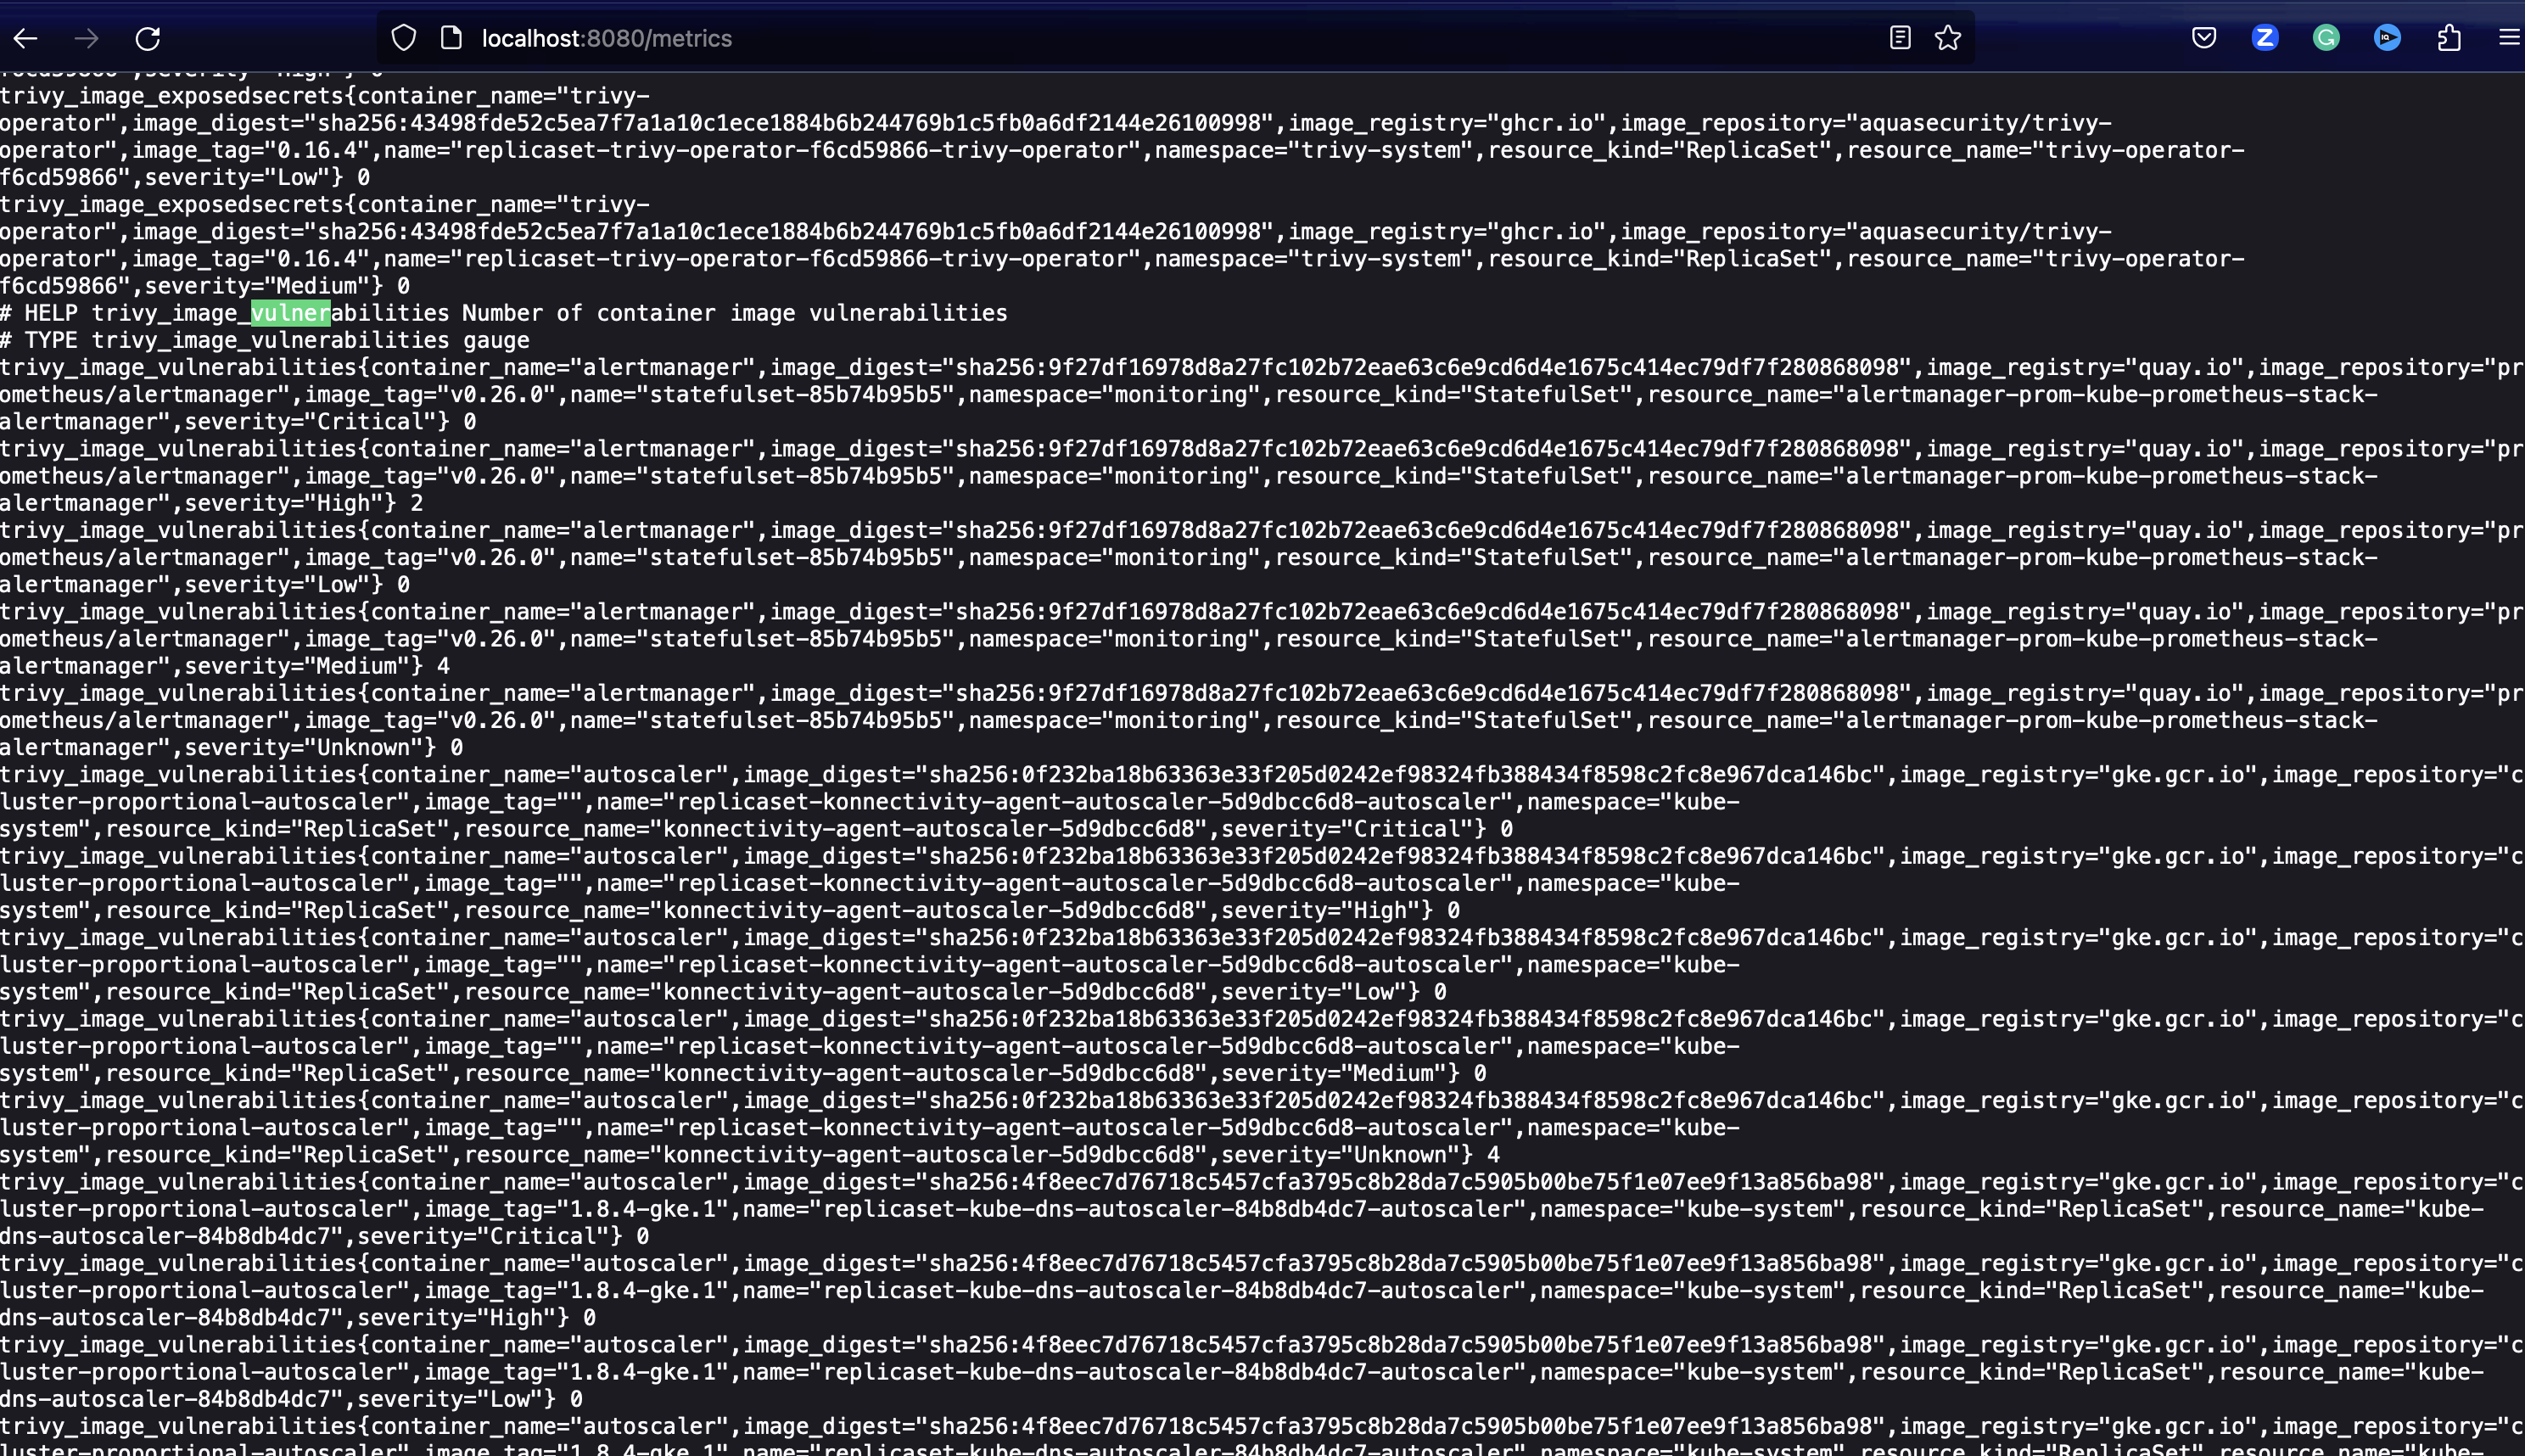
kubectl port-forward service/trivy-operator 8080:80 -n trivy-systemNext, open the Trivy Operator metrics endpoint: http://localhost:8080/metrics
The metrics will look similar to the following:
If we port-forward the Prometheus Service, we can then query specific metrics a lot easier:
kubectl port-forward service/prom-kube-prometheus-stack-prometheus -n monitoring 9090:9090Then it is possible to insert a query e.g.:
sum(trivy_image_vulnerabilities)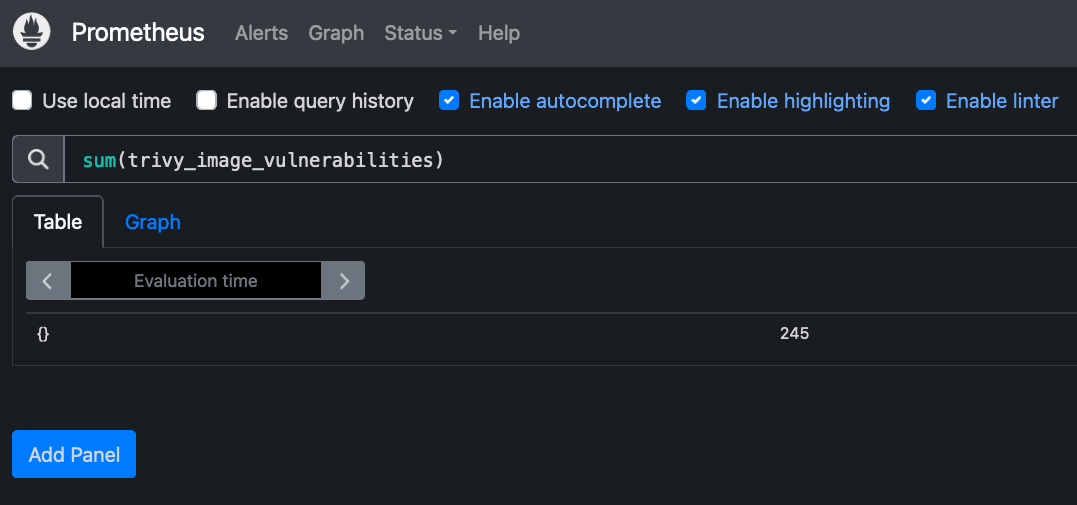
Next, we want to specify that any new CRITICAL Vulnerability should produce a new Alert sent to our Slack Channel. To specify all of our alerts, we will create a new trivy-alerts.yaml manifest:
apiVersion: monitoring.coreos.com/v1
kind: PrometheusRule
metadata:
labels:
prometheus: example-rules
role: alert-rules
name: prom
spec:
groups:
- name: "prom.rules"
rules:
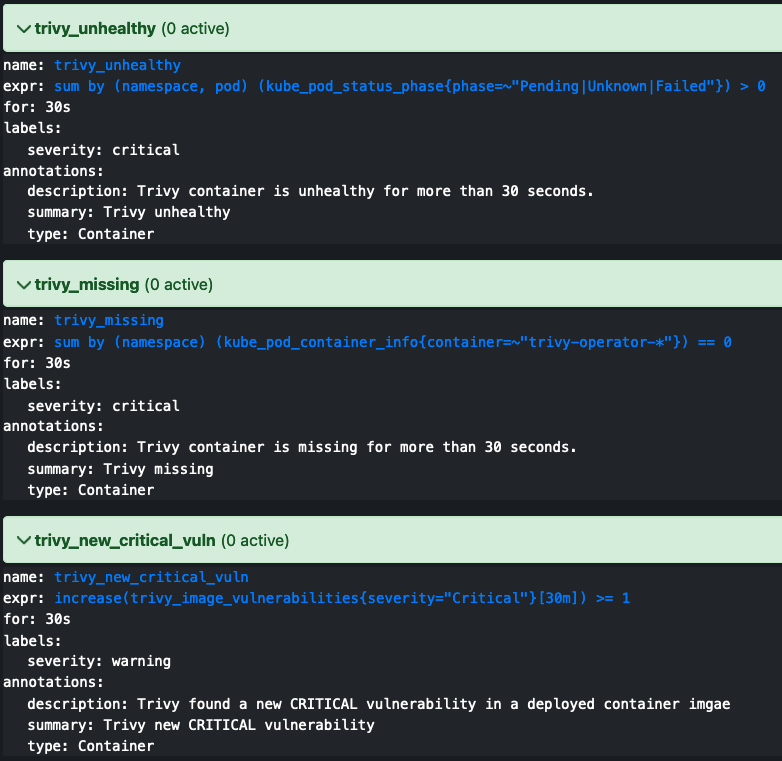
- alert: trivy_unhealthy
expr: sum by (namespace, pod) (kube_pod_status_phase{phase=~"Pending|Unknown|Failed"}) > 0
for: 30s
labels:
severity: critical
annotations:
description: Trivy container is unhealthy for more than 30 seconds.
summary: Trivy unhealthy
type: Container
- alert: trivy_missing
expr: sum by (namespace) (kube_pod_container_info{container=~"trivy-operator-*"}) == 0
for: 30s
labels:
severity: critical
annotations:
description: Trivy container is missing for more than 30 seconds.
summary: Trivy missing
type: Container
- alert: trivy_new_critical_vuln
expr: increase(trivy_image_vulnerabilities{severity="Critical"}[30m]) >= 1
for: 30s
labels:
severity: warning
annotations:
description: Trivy found a new CRITICAL vulnerability in a deployed container imgae
summary: Trivy new CRITICAL vulnerability
type: ContainerEvery Alert consists of the following:
- Alert: This is the name of the alerts
- Expr: This is the Prometheus metrics that will specify what causes the alert to happen in the first place
- For: For how long does the alert have to be true so that a notification is going to be triggered
- Labels:
- Annotation: This section provides additional information on the alert
You can find further information on each alert in the following documentation:
Next, we can apply the trivy-alerts.yaml manifest through kubectl:
kubectl apply -f prom-rule/trivy-alerts.yaml -n monitoringEnsure that:
- You specify the right path to the location of your trivy alerts file
- You specify the right namespace of the alerts
Ensure that the alerts are set up correctly
This is the fun part: to make sure that Prometheus has even received the alerts.
First, port-forward to the Prometheus Service:
kubectl port-forward -n monitoring service/prom-kube-prometheus-stack-prometheus 9090:9090Then, in the top menu, head over to the `alerts` section of the WebUI. Here, you should see your alerts listed. Ensure that you can see the Trivy Alerts. If Trivy is installed correctly, the container-related alerts should appear green. Additionally, if there are no CRITICAL vulnerabilities, the Vulnerability Alerts should also be green.
Let’s trigger an alert
After you have set up a new Prometheus alert, it is generally best practice to test that it works as expected.
To trigger an alert, delete the Trivy-Operator Pod or install a container image with CRITICAL vulnerabilities. For the latter, follow the steps listed below.
First, create a new demo namespace because no one likes to mess with serious, valuable namespaces.
kubectl create ns testNext, create a Kubernetes Deployment inside the `test` namespace. You can find the Deployment on my GitHub repository. It will basically install a vulnerabile React application with 8+ CRITICAL vulnerabilities.
Either copy-paste the Deployment Spec to your local repository or check out the Git Repository if you have not done so in one of the previous sections of this blog post.
And apply the Pod Spec to the `test` namespace:
kubectl apply -f ./app-manifestsAs soon as a new container runs inside the Kubernetes cluster, the Trivy Operator will create a new VulnerabilityReport of the container image. You can view the Vulnerability Reports in the `test` namespace through the following command:
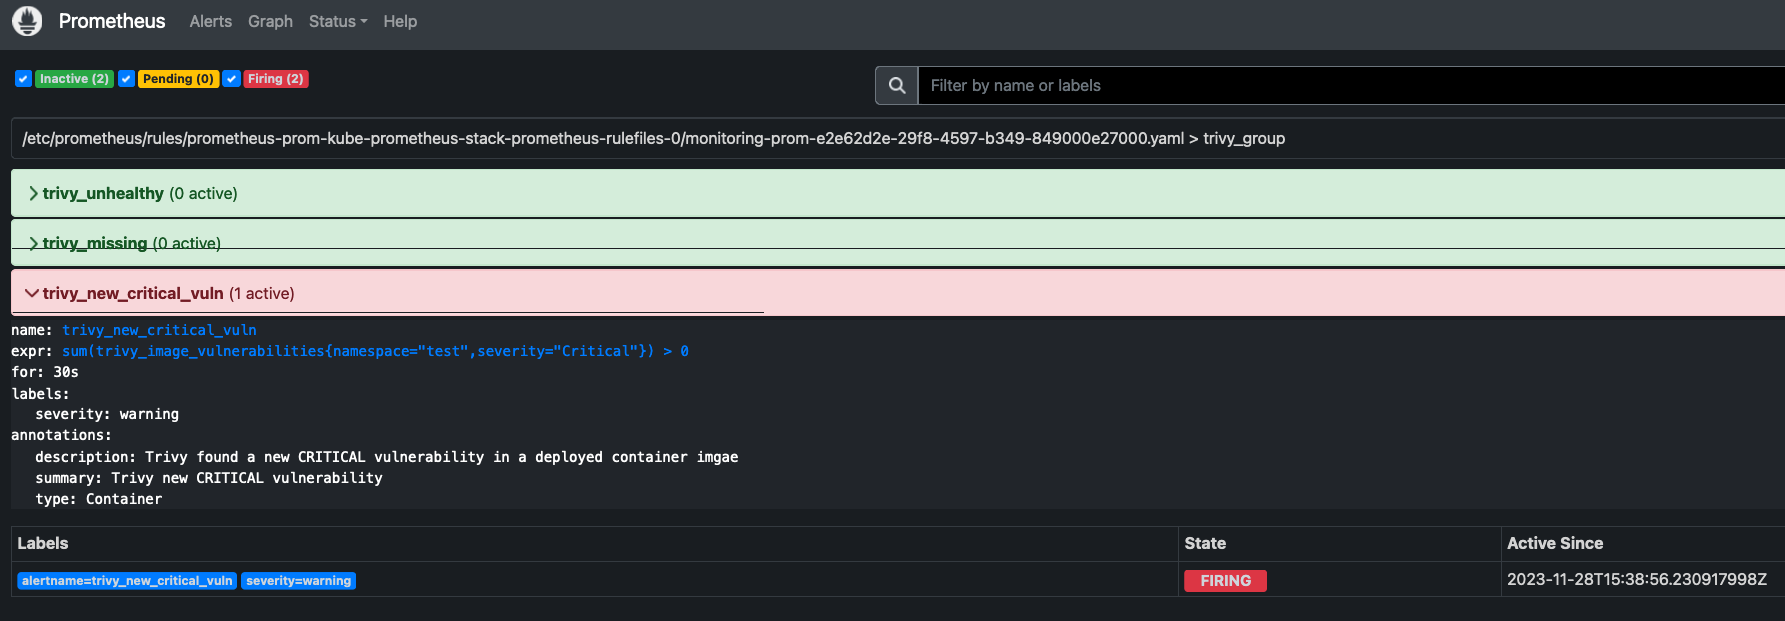
kubectl get VulnerabilityReport -n testNext, we can head to the Prometheus Alert Dashboard to view the Alert firing:
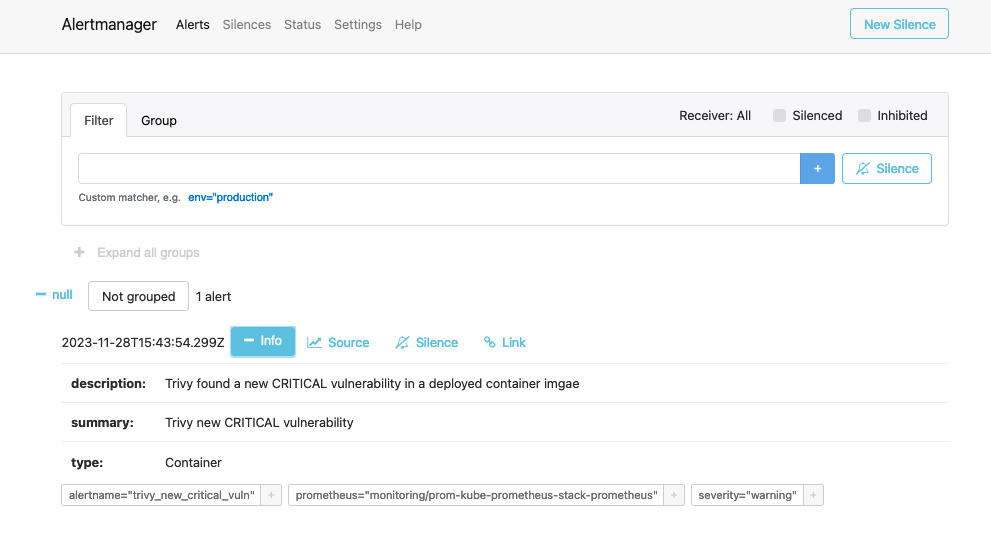
Additionally, the alert that is currently firing will be visible in AlertManager for you to manage:
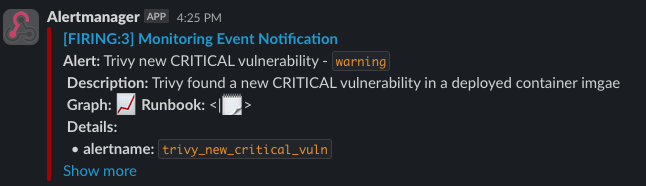
You should also see the alerts in your Slack Channel:
What’s next???
I hope you enjoyed this tutorial. If you like my content and you want to support it, here are some ways:
- Like the video on YouTube: LINK
- Share the video on YouTube through the following link: LINK
- You can also buy me a coffee – I LOOOOOOVEEEE COFFEE!!
Additional resources:
If you would like to learn more about Prometheus and how not to scale Prometheus, the following two talks are a good resource:
- Alerting in the Prometheus Ecosystem: The Past, Present and Future - Josue (Josh) Abreu: https://youtu.be/9AX8u-bt4J8?si=k27mF74cIXWcYuSa
- How Not to Scale Your Prometheus in Production? - Kush Trivedi & Nikola Collins, DevRev: https://youtu.be/5BqZqGcM4-g?si=JbRZaBHAcsGodBof
- The Prometheus Operator has a webhook example for AlertManager https://github.com/prometheus-operator/prometheus-operator/blob/main/Documentation/user-guides/alerting.md
- Kubernetes Monitoring | Alertmanager: https://youtu.be/7qjxAApQyTY?si=URQzvhKeHz3aoAqG
Excellent example Alert rules: https://samber.github.io/awesome-prometheus-alerts/rules.html