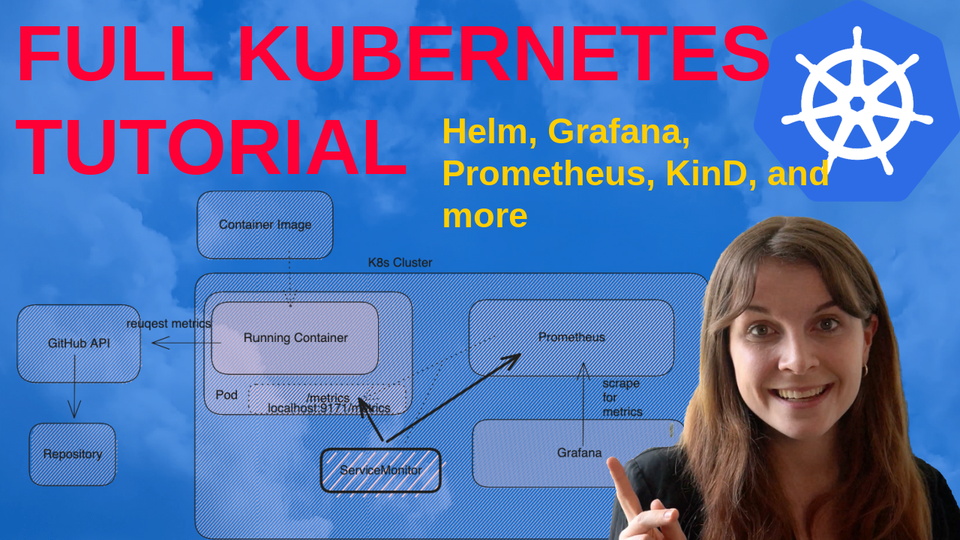
Visualise GitHub Metrics with Grafana and Prometheus - everything you need to get started with Kubernetes
In this tutorial, we are going to learn about:
- Setting up your first Kubernetes cluster with KinD
- Installing Docker Desktop, KinD, kubectl, Helm
- Installing the kube Prometheus stack Helm Chart that provides Grafana and Prometheus
- Understanding and customising Helm Charts
- Showing you how the different components interact in your KinD cluster
- Port-forwarding an application
- Installing an application through Kubernetes YAML Manifests
- How Service and Deployments in Kubernetes interact
- How to use a ServiceMonitor for Prometheus
- Verify access to metrics in Prometheus
- Setting up a Grafana Dashboard
to create a Grafana Dashboard that visualizes statistics of a GitHub repository.
This blog post is an end-to-end tutorial. While not everything will make sense to you if you have no Kubernetes or Linux experience or similar, this blog post and video tutorial can
- Provide you with a first practical example of using Kubernetes if you are completely new to the technology
- Expand your existing understanding if you already have some experience with the tooling and might provide you with further insights.
- You can also use this tutorial as a starting point for your own project.
Thank to the people who created the GitHub Exporter
I got the idea for this tutorial as I was looking at ways to visualise social media metrics and came across the GitHub exporter by GitHub Exporter:


Thank you so much for the work!
The GitHub repository with the resources used in this tutorial can be found here: https://github.com/Cloud-Native-Security/github-exporter/tree/main
Prerequisites
In this section, we are going to install all of the tools that you need to follow this tutorial.
Docker
First, if you do not have Docker Desktop and the docker CLI installed or a similar container runtime, then go ahead and install Docker for your Operating System.
Make sure that you have access to docker from your CLI:
docker version
Client:
 Version:           20.10.17-rd
 API version:       1.41
Kubernetes cluster
For this tutorial, we need a Kubernetes cluster as we are going to install and run all our tools on top.
Note that you can jump to the next step if you already have access to a Kubernetes cluster.
Here are the different steps for creating a Kubernetes cluster -- I will explain the different components of your cluster alongside.
First, Install the kubectl CLI
kubectl is a command line tool that allows you to communicate with the Kubernetes API inside your Kubernetes cluster.
"For configuration, kubectl looks for a file named config in the $HOME/.kube directory. You can specify other kubeconfig files by setting the KUBECONFIG environment variable or by setting the --kubeconfig flag." Documentation
Install kubectl by choosing the installation option based on your Operating System.
Once done, make sure that kubectl is installed in your environment by running the following command:
kubectl version
Install KinD CLI
In this tutorial, we are going to use KinD Kubernetes cluster. KinD basically spins up a one-node Kubernetes cluster as a Docker Container.
You can also configure KinD to provide multiple nodes for the cluster. However, a one-node cluster is fine for our purposes.
Install KinD CLI in your terminal
You can find several different installation options in the KinD documentation. We are going to use Homebrew to install the KinD CLI. However, depending on your Operating System, you might want to use another installation option.
Once installed, make sure you can request the version:
kind version
kind v0.20.0 go1.20.5 darwin/arm64
Create your cluster
With KinD, it is super straightforward to spin up a new KinD cluster. The command for this has the following structure:
create cluster --name exampleOnce you run the command, KinD will build you a one-node Kubernetes cluster, called "kind-example".
Ensure that you can query the number of nodes inside your cluster with kubectl which we installed earlier in the tutorial:
kubectl get nodesKinD should have connected your kubectl installation automatically with the new cluster.
This should return something along the following:
NAME                    STATUS   ROLES           AGE    VERSION
example-control-plane   Ready    control-plane   108s   v1.27.3
Note that usually, in a production setting or similar, you would run a cluster with at least three nodes. However, to showcase Kubernetes functionality, a one-node cluster is a good start.
Different Kubernetes components
Now that we have a basic Kubernetes cluster up and running, we can look at the different components of the cluster.
Every K8s cluster will have a control plane, also called the master node. This is where the main Kubernetes components are hosted. You can take a look at them by querying the kube-system namespace of your cluster:
❯ kubectl get all -n kube-system
NAME                                                READY   STATUS    RESTARTS   AGE
pod/coredns-5d78c9869d-lj5qh                        1/1     Running   0          3m32s
pod/coredns-5d78c9869d-tc59t                        1/1     Running   0          3m32s
pod/etcd-example-control-plane                      1/1     Running   0          3m45s
pod/kindnet-9c6bq                                   1/1     Running   0          3m32s
pod/kube-apiserver-example-control-plane            1/1     Running   0          3m47s
pod/kube-controller-manager-example-control-plane   1/1     Running   0          3m45s
pod/kube-proxy-2wstn                                1/1     Running   0          3m32s
pod/kube-scheduler-example-control-plane            1/1     Running   0          3m46s

NAME               TYPE        CLUSTER-IP   EXTERNAL-IP   PORT(S)                  AGE
service/kube-dns   ClusterIP   10.96.0.10   <none>        53/UDP,53/TCP,9153/TCP   3m46s

NAME                        DESIRED   CURRENT   READY   UP-TO-DATE   AVAILABLE   NODE SELECTOR            AGE
daemonset.apps/kindnet      1         1         1       1            1           kubernetes.io/os=linux   3m44s
daemonset.apps/kube-proxy   1         1         1       1            1           kubernetes.io/os=linux   3m46s

NAME                      READY   UP-TO-DATE   AVAILABLE   AGE
deployment.apps/coredns   2/2     2            2           3m46s

NAME                                 DESIRED   CURRENT   READY   AGE
replicaset.apps/coredns-5d78c9869d   2         2         2       3m33s
Note that in managed Kubernetes clusters by cloud providers, you would not necessarily have access to those components. Also, in clusters with multiple nodes, the components are hosted on one of the nodes.
It is possible to query all of the namespaces that you have in your cluster with the following command:
❯ kubectl get namespace
NAME                 STATUS   AGE
default              Active   4m52s
kube-node-lease      Active   4m52s
kube-public          Active   4m52s
kube-system          Active   4m52s
local-path-storage   Active   4m48s
What is a namespace?
All of the above namespaces run inside the same Kubernetes cluster. A namespace provides a logical separation of concern between your application stack and other components.
You can create new namespaces e.g. run the following command to create an app namespace:
kubectl create namespace app

namespace/app created
Here is a graphical overview of your Kubernetes cluster and the different components that Kubernetes uses to run it:
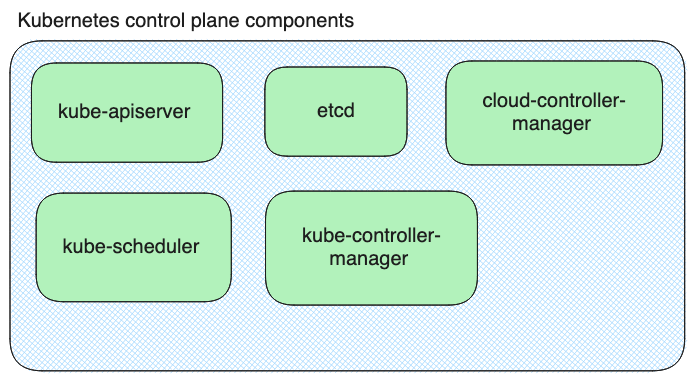
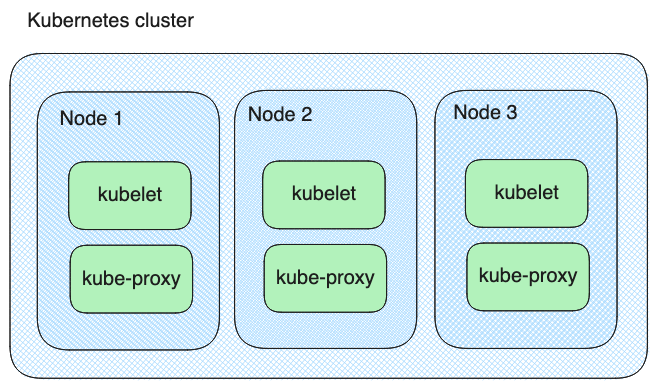
Furthermore, each Kubernetes cluster node will run the following components:
While you are getting started, you don't have to know the details of each Kubernetes component. However, it will become more handy when you are running more complex deployments. Also, when you are applying to a DevOps or Kubernetes-related role, it is likely that the interviewer will ask you about the different components that Kubernetes relies on.
To learn more, have a look at this live stream with Hannah on my YouTube channel, where she explained the details of each component:
She Can Cloud Native: Kubernetes 101 - What I wish I knew as a Developer
Additionally, you can find a detailed description of each in the Kubernetes documentation.
Installing Helm
Lastly, we need to install Helm. Helm is another tool that allows us to interact with our Kubernetes cluster, manage resources, deploy resources, update resources, and much more. It is basically like a package manager for Kubernetes.
For this tutorial, you don't have to know much about Helm to follow along. However, if you want to learn more, here is a list of Helm tutorials from my YouTube channel:
Next, go ahead and install the Helm CLI in your terminal.
Then, make sure that you have access to Helm by running the following command:
helm version
version.BuildInfo{Version:"v3.9.1", GitCommit:"a7c043acb5ff905c261cfdc923a35776ba5e66e4", GitTreeState:"clean", GoVersion:"go1.17.5"}
Installing Kubernetes Applications
This section builds upon the previous section. We will see how we can install complete Kubernetes applications.
Now that we have everything installed and up and running, we can go ahead and install some Kubernetes-focused applications into our cluster. This section will detail how we are installing both Prometheus and Grafana into our cluster using a Helm Chart. We will look at how we can customize a Helm Chart, install the resource, and verify that our deployment works as expected.
Prometheus Overview
For more information on Prometheus/a video introduction and overview, watch this video:
Grafana Overview
Installation
You can find most Helm Charts by looking for the application that you would like to install e.g. Google "Prometheus Helm Chart". In this case, you might come across the Helm Chart that we are going to use in this tutorial, called the Prometheus Stack Helm Chart.
Take a look at the Helm Chart in the following Repository: https://github.com/prometheus-community/helm-charts/tree/main/charts/kube-prometheus-stack
Every Helm Chart has a values.yaml manifest that specifies the fields in the Helm Chart for the Kubernetes application installation that can be customised. In our case, we want to customise a few fields.
First, create a new file in a directory of your choice called values.yaml
Next, add the following content to the file:
prometheus:
  prometheusSpec:
    serviceMonitorSelectorNilUsesHelmValues: false
    serviceMonitorSelector: {}
    serviceMonitorNamespaceSelector: {}
    scrapeTimeout: "90s"
    scrapeInterval: "90s"

grafana:
  sidecar:
    datasources:
      defaultDatasourceEnabled: true
We need to make these customizations so that Prometheus can pick up the information for our custom application later on. The way that Prometheus works is that it uses resources called ServiceMonitors that scrape your applications for exposed metrics and forward those metrics to Prometheus.
Next, we need to add the Helm registry where the Kube Prometheus Stack Helm Chart is stored to the registries that our local Helm Installation knows about:
helm repo add prometheus-community https://prometheus-community.github.io/helm-charts
A Helm registry is similar to a repository. It allows you to store Helm Charts. Our local Helm CLI needs to know where to find the right Helm Charts.
Then make sure to update your Helm Charts:
helm repo updateThis will pull the latest information from the remote registry.
It is generally best practice to separate the different applications in your Kubernetes cluster into different namespaces. The following command will create a new namespace called monitoring in which we can install the Helm Chart and any other monitoring or observability-related tools:
kubectl create ns monitoringNow that we have everything we need to install the Kube Prometheus Stack Helm Chart, we can go ahead and install it with the following command into our KinD Kubernetes cluster:
helm upgrade --install prom prometheus-community/kube-prometheus-stack -n monitoring --values values.yamlOnce installed, you will receive a success message, similar to the following:
❯ helm upgrade --install prom prometheus-community/kube-prometheus-stack -n monitoring --values values.yaml
Release "prom" does not exist. Installing it now.
NAME: prom
LAST DEPLOYED: Fri Jul 14 16:31:37 2023
NAMESPACE: monitoring
STATUS: deployed
REVISION: 1
NOTES:
kube-prometheus-stack has been installed. Check its status by running:
  kubectl --namespace monitoring get pods -l "release=prom"

Visit https://github.com/prometheus-operator/kube-prometheus for instructions on how to create & configure Alertmanager and Prometheus instances using the Operator.
Next, we can make sure that all of the resources that got installed are running correctly inside our cluster. This is done by requesting all of the resources in our monitoring namespace:
kubectl get all -n monitoringYou should see something similar to the following output:
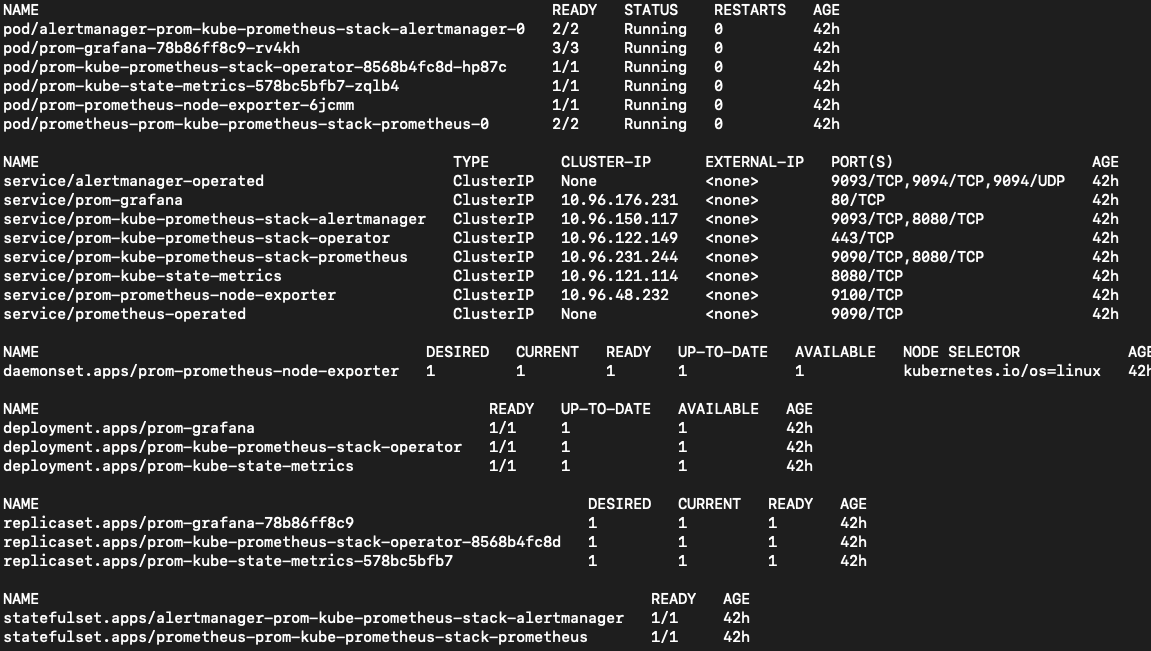
Let's break it down what we can see here:
- When you write an application, you have the application code.
- Next, you can package the application code into a container image. This is done through a Dockerfile. The Dockefile specifies what has to go into that container image and how the code in the container image is supposed to run.
- Once you have the Dockerfile, you can then build an instance of the container image. Each container image tag will refer to a different instance or version of the container image e.g. the code and the way the code is packaged up in the container image.
- Once you run a container image, you have an instance of a running container.
- When you deploy a container image to a Kubernetes cluster through Kubernetes YAML manifests, the container will run inside of a Kubernetes Pod. Kubernetes YAML manifests and other configuration files e.g. Terraform, allow you to configure the way your application is supposed to run.
- A Kubernetes Pod is the smallest running resource inside your Kubernetes Pod. Kubernetes Deployments allow you to manage multiple Pods that run the same container image in different Pods. The number of instances of a Pod that is supposed to run is specified through another Kubernetes resource called the ReplicaSet.
- Without going too much into Kubernetes Networking in this tutorial. Each Pod has an IP address assigned inside the cluster. However, whenever a container image dies and spins back up, it receives a different IP address. To allow for a more stable connection to the applications running inside the Pods, you can connect Kubernetes Service to a Kubernetes Deployment or Pod. The Kubernetes Service will not change if the Pod is recreated. This allows for a more stable connection.
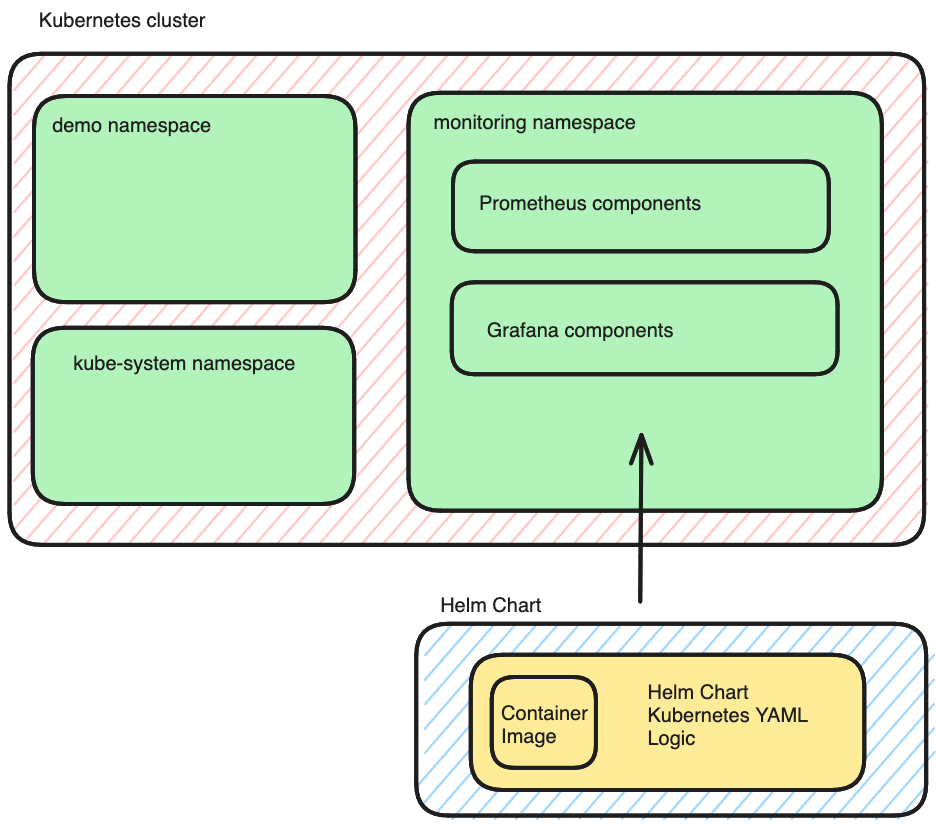
The image below provides a visualization of the different components inside your Kubernetes cluster:
For more information on the different types of Kubernetes resources, have a look at my previous YouTube videos:
Note: I will post updated versions of these videos. So, please subscribe to my YouTube channel.


Connect to Prometheus and Grafana
Lastly, we want to learn how we can connect to our running application. This is done by port-forwarding to the Service
To connect to Prometheus, run the following command:
kubectl port-forward service/prometheus-operated -n monitoring 9090:9090Then open localhost:9090
To connect to Grafana, run this command:
kubectl port-forward service/prom-grafana -n monitoring 3000:80Open localhost:3000 and you will see a log-in option. In our case, the credentials will be the following:
username: admin
password: prom-operator
Custom Application
In this section, we are going to take a container image all the way to deploying it into our cluster to run it on Kubernetes.
In this section, we are going to deploy our custom GitHub exporter.
The GitHub exporter will extract metrics from GitHub through the GitHub API and expose those metrics at a /metrics endpoint of the application.
First, we need to build a container image. The container image is using the Dockerfile in the following GitHub repository. Here is how it has been built:
docker build -t <image-name> .

docker run -d --restart=always -p 9171:9171 -e REPOS="GITHUB-USERNAME/REPO>
Note that we are not going to run the container image like this, instead we will deploy a Kubernetes Deployment and a Kubernetes Service to our Kubernetes cluster.
We want to deploy both resources into their separate namespace, so first we will create a new namespace for them:
kubectl create ns demoThen, create a deployment.yaml file for our Kubernetes Deployment:
apiVersion: apps/v1
kind: Deployment
metadata:
  name:  gh-exporter
spec:
  replicas: 1
  selector:
    matchLabels:
      run:  gh-exporter
  template:
    metadata:
      labels:
        run:  gh-exporter
    spec:
      containers:
      - name: gh-exporter
        image: docker.io/anaisurlichs/gh-exporter:0.0.1
        env:
        - name: REPOS
          value: "aquasecurity/trivy, aquasecurity/trivy-operator, aquasecurity/tracee"
        - name: GITHUB_TOKEN
          value: "test"
        ports:
          - containerPort: 9171
        imagePullPolicy: Always
        resources:
          limits:
            memory: 512Mi
            cpu: 200m
        securityContext:
          allowPrivilegeEscalation: false
At this point, we need to change some of the environment variables. The first one is the REPOS that we want to track. Put in any repositories that you would like to look at in your Grafana Dashboard.
Next, we want to replace the GITHUB_TOKEN. This will allow us to query the GitHub API more often. To generate a new token, navigate to your GitHub Account > Settings > Developer Settings and then to Personal Access Tokens and generate a new classic token with the following scope:
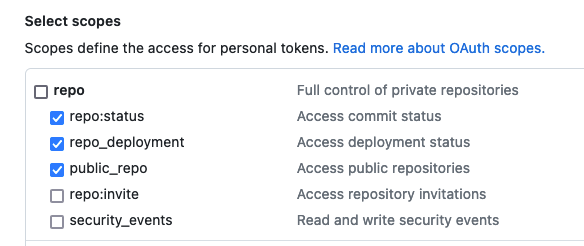
You do not need to give it access to anything else. Once you have created the Access token, paste it into the deployment.yaml manifest. We will see in the next videos how you can manage secrets in Kubernetes in a better way.
Apply the Kubernetes Deployment into the demo namespace inside your Kubernetes cluster:
kubectl apply -f deployment.yaml -n demoNow create a new file called service.yaml for the Kubernetes service:
apiVersion: v1
kind: Service
metadata:
  name: gh-exporter
  labels:
    run: gh-exporter
spec:
  type: ClusterIP
  ports:
  - port: 9171
    targetPort: 9171
    protocol: TCP
    name: http
  selector:
    run: gh-exporter
And then apply the service manifest also to the demo namespace of your Kubernetes cluster:
kubectl apply -f service.yaml -n demoLastly, we need to make sure that Prometheus can view our metrics from our GitHub exporter deployment. For this, we will create a new file called a ServiceMonitor . This file is part of the Kubernetes Custom Resources, Kubernetes resources that extend the Kubernetes API
apiVersion: monitoring.coreos.com/v1
kind: ServiceMonitor
metadata:
  name: gh-exporter
  labels:
    run: gh-exporter
spec:
  endpoints:
  - port: http
    path: /metrics
    scrapeTimeout: 90s
  selector:
    matchLabels:
      run: gh-exporter
Similar to before, we need to apply this new resources to our Kubernetes cluster:
kubectl apply -f servicemonitor.yaml -n demoNow, going back to our Prometheus Dashboard from the previous section. First, we need to make sure that Prometheus is scraping the cluster correctly for our exporter metrics. We can see this under Status and then Targets.
You should see the service being up and scraped:
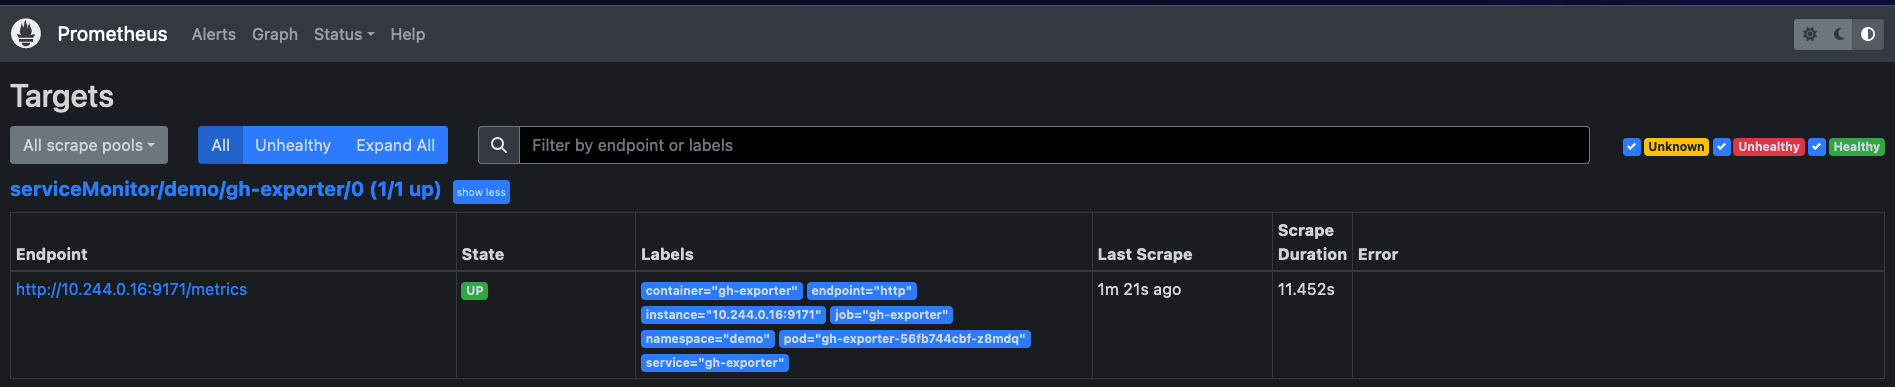
We can go ahead and query for our GitHub metrics in Prometheus.
To know which metrics we have access to, we firs was to run a port-forward to the service of our GitHub exporter:
kubectl port-forward -n demo service/gh-exporter 9171:917This will allow you to open the metrics for the GitHub exporter on localhost:9171/metrics
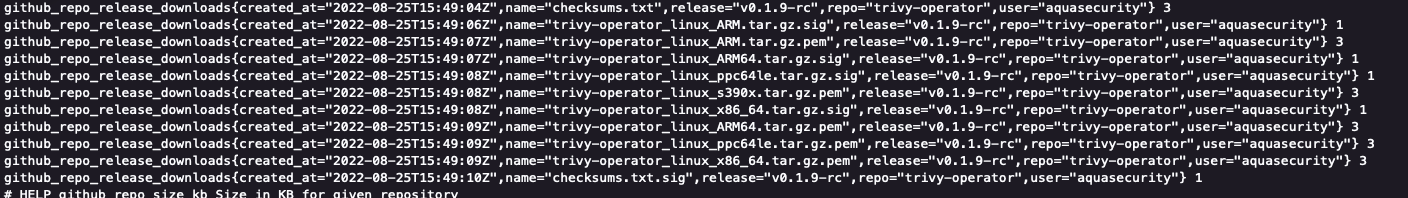
You should see something similar to the following screenshot:
Next, we can open the Prometheus UI (http://localhost:9090/graph) and input a query such as the following:
github_repo_stars

github_repo_stars{repo="trivy"}
The same queries can be used directly in Grafana. Either you can navigate to 'Explore' and create queries there or you can start a new Dashboard.
To start a new Dashboard, first open Dashboards then New < New Dashboards – and here you will be able to create a new Dashboard.
I already created an example Dashboard which is in the repository under monitoring-resources/grafana-dashboard.json.
You can copy the content of this json file that contains the dashboard. The navigate in your new Grafana dashboard settings > JSON Model – and paste your new Dashboard here.
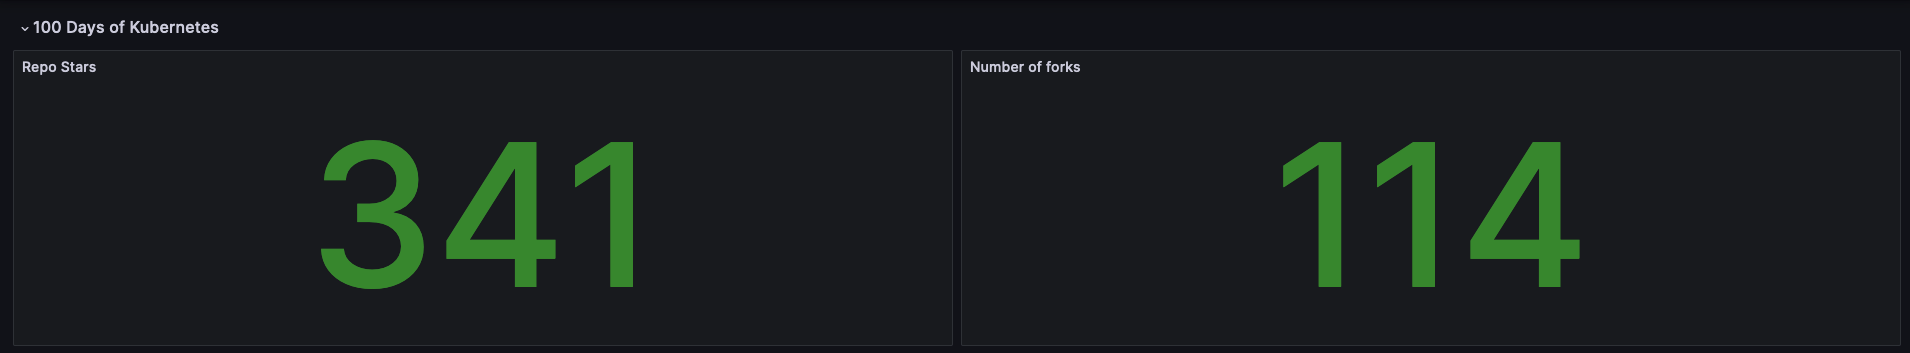
You should see something similar to the following:

Note that you might have to edit the panels if you used your own GitHub repositories.
What's Next?
WOW WE DID IT!!!
GREAT JOB for following along this very long tutoria. I really hope it worked for you.
Please support my content
These tutorials take a LOOOONG time to make. I would highly appreciate if you could give the YouTube video for this tutorial a Thumbs-up and subscribe to my YouTube
Weekly DevOps Newsletter
Also I have a weekly DevOps Newsletter where I share free online learning resources from across the DevOps space right to your inbox:
 Anais Urlichs