Kubernetes Security through GitOps Best Practices: ArgoCD and Starboard
GitOps is the principle of managing all of our resources through Git. Whether that is code, infrastructure, secrets or anything else. Anything that our application deployment may depend on has to be visible in Git. If you are completely new to GitOps, I highly suggest you check out this blog post that I wrote on the New Stack.
Usually, when we talk about GitOps, we talk about our application deployment and any resources that our application may depend on - we don’t talk about Kubernetes Security.
However, if
- GitOps allows us to manage all resources through Git,
- And the Kubernetes API allows us to have all of our resources be deployed and represented as Kubernetes resources,
then we can also deploy and manage our Kubernetes Security through GitOps.
What do I mean by Kubernetes Security?
I don’t 100% know what others talk about when they say “Kubernetes Security”. So when I say Kubernetes Security, I am referring to all the tools and other resources that help me secure my Kubernetes Cluster. Some applications may help me to configure my Kubernetes Resources before deployment while others help me to monitor my running workloads inside my cluster.
In this tutorial we are going to:
- Install ArgoCD
- See how we can manage Helm Charts through ArgoCD declaratively
- Define Resources for our Starboard deployment
- Deploy Starboard
- Define monitoring resources for Grafana & Prometheus
- Deploy those monitoring resources
- Define Resources for Starboard Exporter
- Deploy Starboard exporter
- See metrics in Prometheus
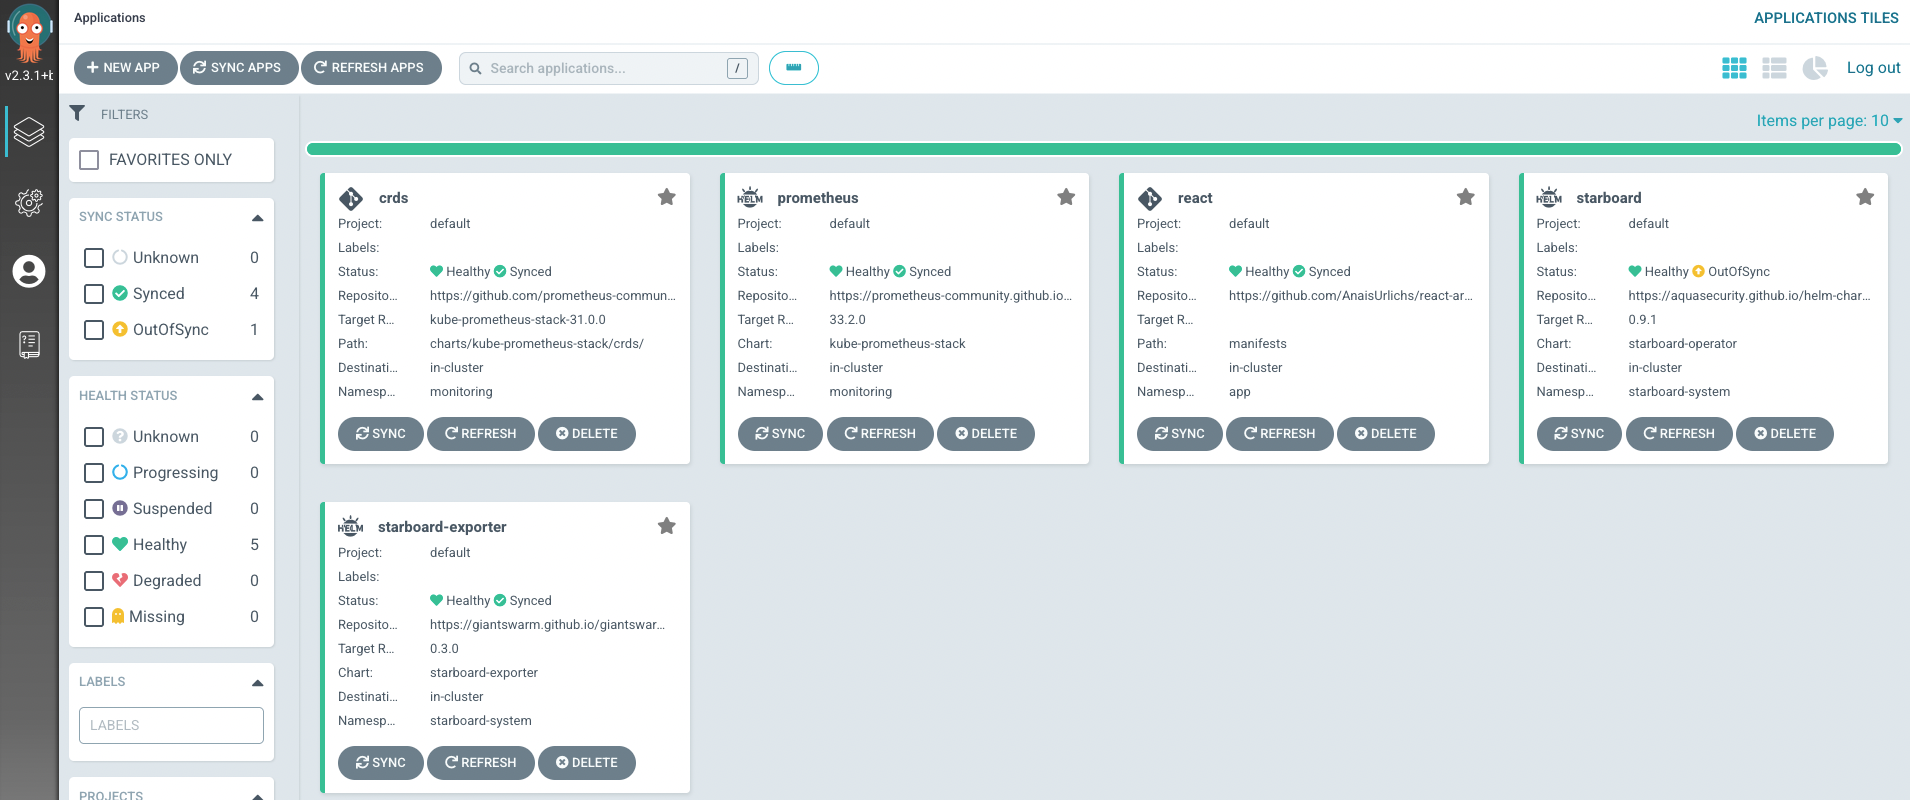
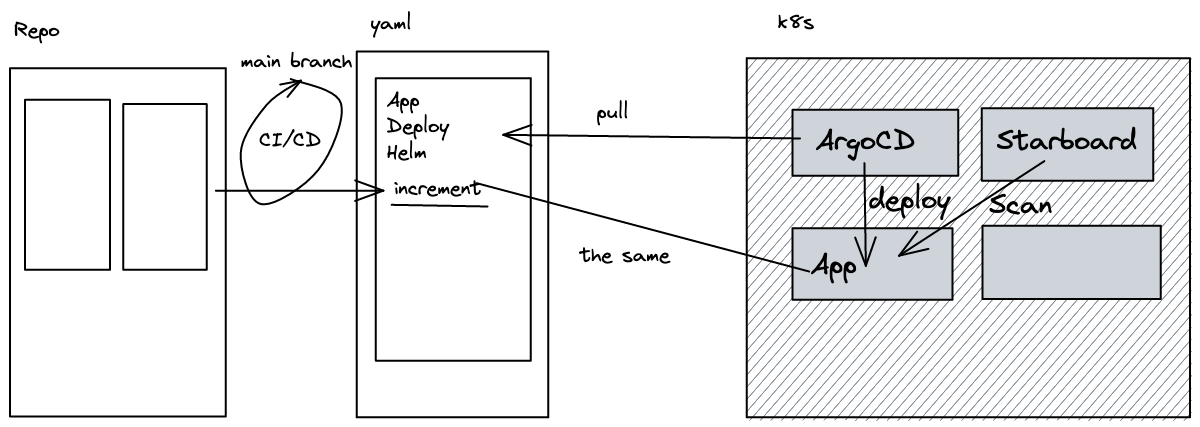
You can see the setup that we will have in the end in the following screenshot:
If you prefer video content, the video is linked below for this tutorial.
What is Starboard and why make an entire tutorial about it?
We have seen lots of tutorials on GitOps before and you all probably know my love for ArgoCD by now.
I previously made a tutorial where I was just providing an introduction to Starboard.
Starboard attempts to integrate heterogeneous security tools by incorporating their outputs into Kubernetes CRDs (Custom Resource Definitions) and from there, making security reports accessible through the Kubernetes API. This way users can find and view the risks that relate to different resources in what we call a Kubernetes-native way.
People don’t talk enough about Kubernetes Security and applications that help us enforce best practices. Partially because it is assumed to be “unnecessary” or too difficult for the normal Kubernetes administrator. I am still learning about Kubernetes and Cloud Native Security, and I can assure you, you cannot start early enough.
Starboard is completely open source, give it a star and learn how to contribute:
 aquasecurity
Prerequisites
To follow along with this blog post, you need:
- A Kubernetes cluster
- kubectl installed and connected to your Kubernetes cluster
- An explorer mood ✨
Install ArgoCD on your Kubernetes cluster
First, we are going to create several namespaces for our various resource deployments:
kubectl create namespace argocd

kubectl create namespace starboard-system

kubectl create namespace monitoring

kubectl create namespace app
The naming of each namespace will give you a hint on the type of applications we are going to use throughout the tutorial.
Next up, we are installing the ArgoCD resources:
kubectl apply -n argocd -f https://raw.githubusercontent.com/argoproj/argo-cd/stable/manifests/install.yaml
This is basically just following the documentation.
Have a look at the ArgoCD namespace to make sure everything is installed properly:
kubectl get all -n argocd
Note, you might have to wait a few seconds since ArgoCD will want to install lots of resources.
For later steps, you will want to make sure that you have the ArgoCD CLI installed:
brew install argocd
You can find alternative installation methods can be found in the documentation here: https://argo-cd.readthedocs.io/en/stable/getting_started/#2-download-argo-cd-cli
To access the ArgoCD UI and/or to login, follow these commands:
kubectl patch svc argocd-server -n argocd -p '{"spec": {"type": "LoadBalancer"}}'
Next, you can port-forwards the service:
kubectl port-forward svc/argocd-server -n argocd 8080:443
Note that without port-forwarding the service, you cannot communicate with ArgoCD and tell it about the resources that you want to deploy.
In a new terminal tap, access the password:
kubectl -n argocd get secret argocd-initial-admin-secret -o jsonpath="{.data.password}" | base64 -d; echo
and log into the server to send data to ArgoCD:
argocd login <ARGOCD_SERVER>
Note that the ARGOCD_SERVER is likely going to be localhost:8080 depending on the port that you forwarded the ArgoCD Service to in the previous step.
Install the Starboard Operator
Like all other Kubernetes resources, we want to manage our security resources through ArgoCD as well. In this case, we are going to use Starboard — specifically, the Starboard Operator to manage our cluster security.
We are going to deploy Starboard declaratively through a Kubernetes resource. Let’s call it argocd-starboard.yaml:
apiVersion: argoproj.io/v1alpha1
kind: Application
metadata:
  name: starboard
  namespace: argocd
spec:
  project: default
  source:
    chart: starboard-operator
    repoURL: <https://aquasecurity.github.io/helm-charts/>
    targetRevision: 0.9.1
    helm:
      values: |
        targetNamespaces: app
        trivy:
          ignoreUnfixed: true
  destination:
    server: <https://kubernetes.default.svc>
    namespace: starboard-system
  syncPolicy:
    automated:
      prune: true
      selfHeal: true
Now you have two options. The first one is that you can directly deploy the resource through kubectl:
kubectl apply -f starboard-helm.yaml
Make sure to replace starboard-helm.yaml with whatever you named your file.
However, this option is not very GitOps like. Thus, what we can do instead is to push this resource to Git and tell ArgoCD about our Git Repository. ArgoCD will then compare the desired state in Git with the actual state inside of our cluster and apply any resources that are missing to match the desired state with the actual state.
Here is my GitHub repository where you can find the ArgoCD manifests.
The second option is to tell ArgoCD about our manifest inside of our repository.
The way I am telling ArgoCD about my repository is through the following kubectl command:
kubectl apply -n argocd -f https://raw.githubusercontent.com/AnaisUrlichs/argocd-starboard/main/starboard/argocd-starboard.yaml
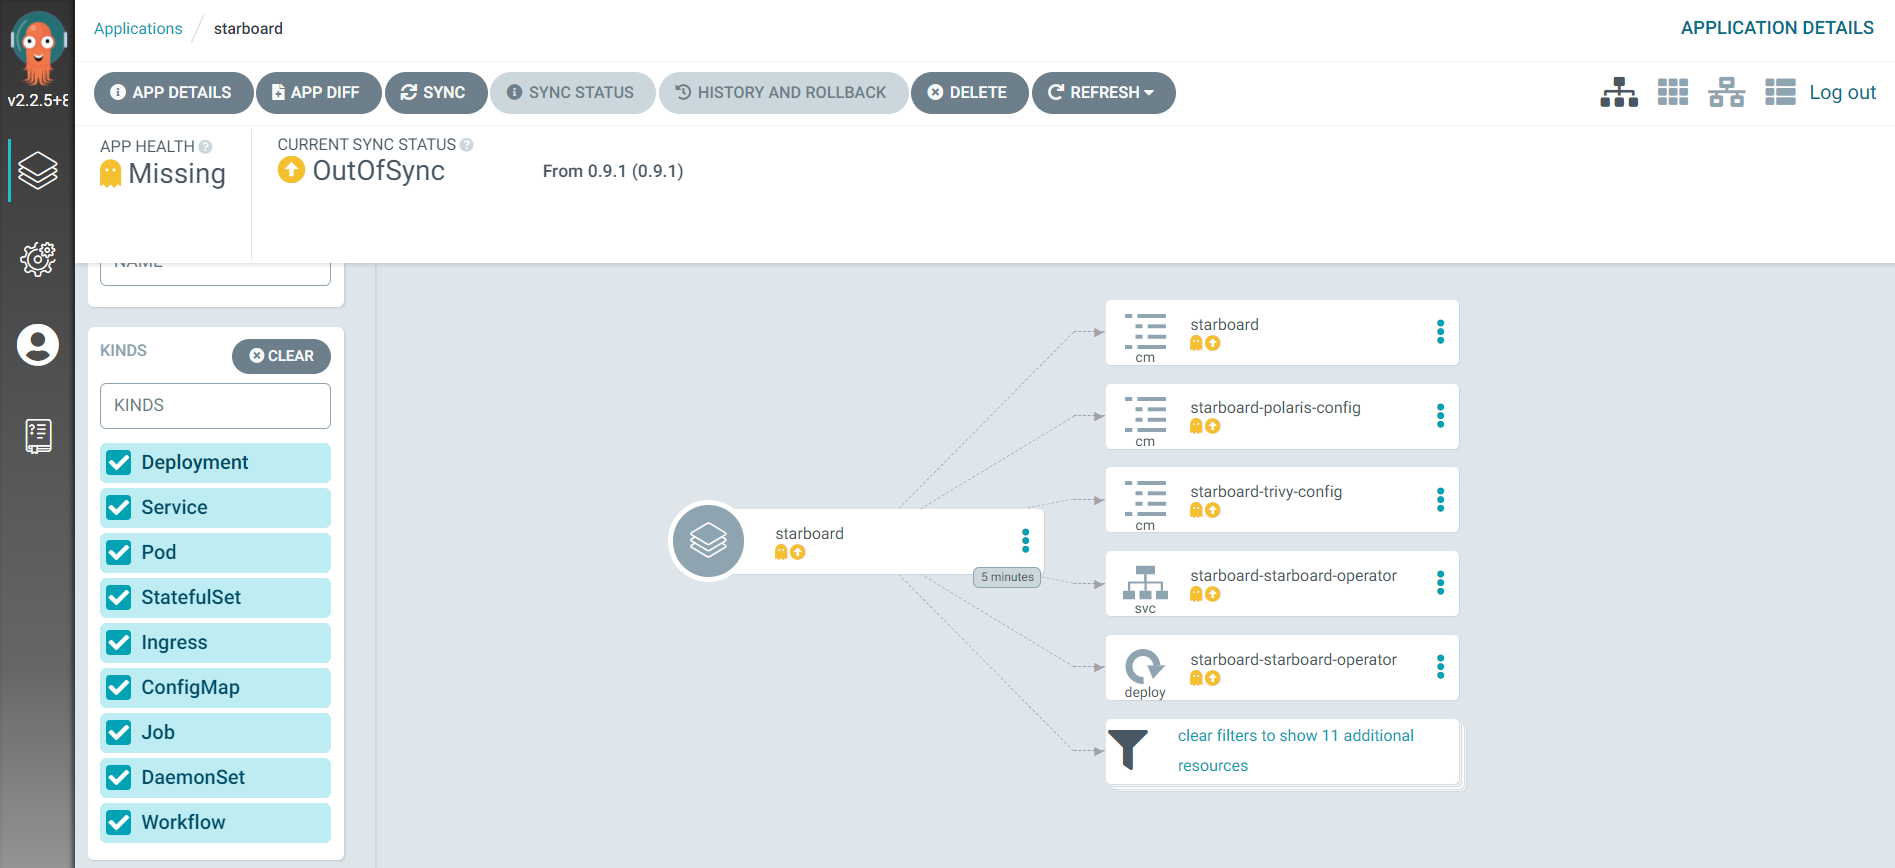
When you open the ArgoCD UI, you will see the following resources, they are not synced with the cluster yet, we are going to apply a manual sync. You could also trigger the sync through the ArgoCD UI.
argocd app sync starboard
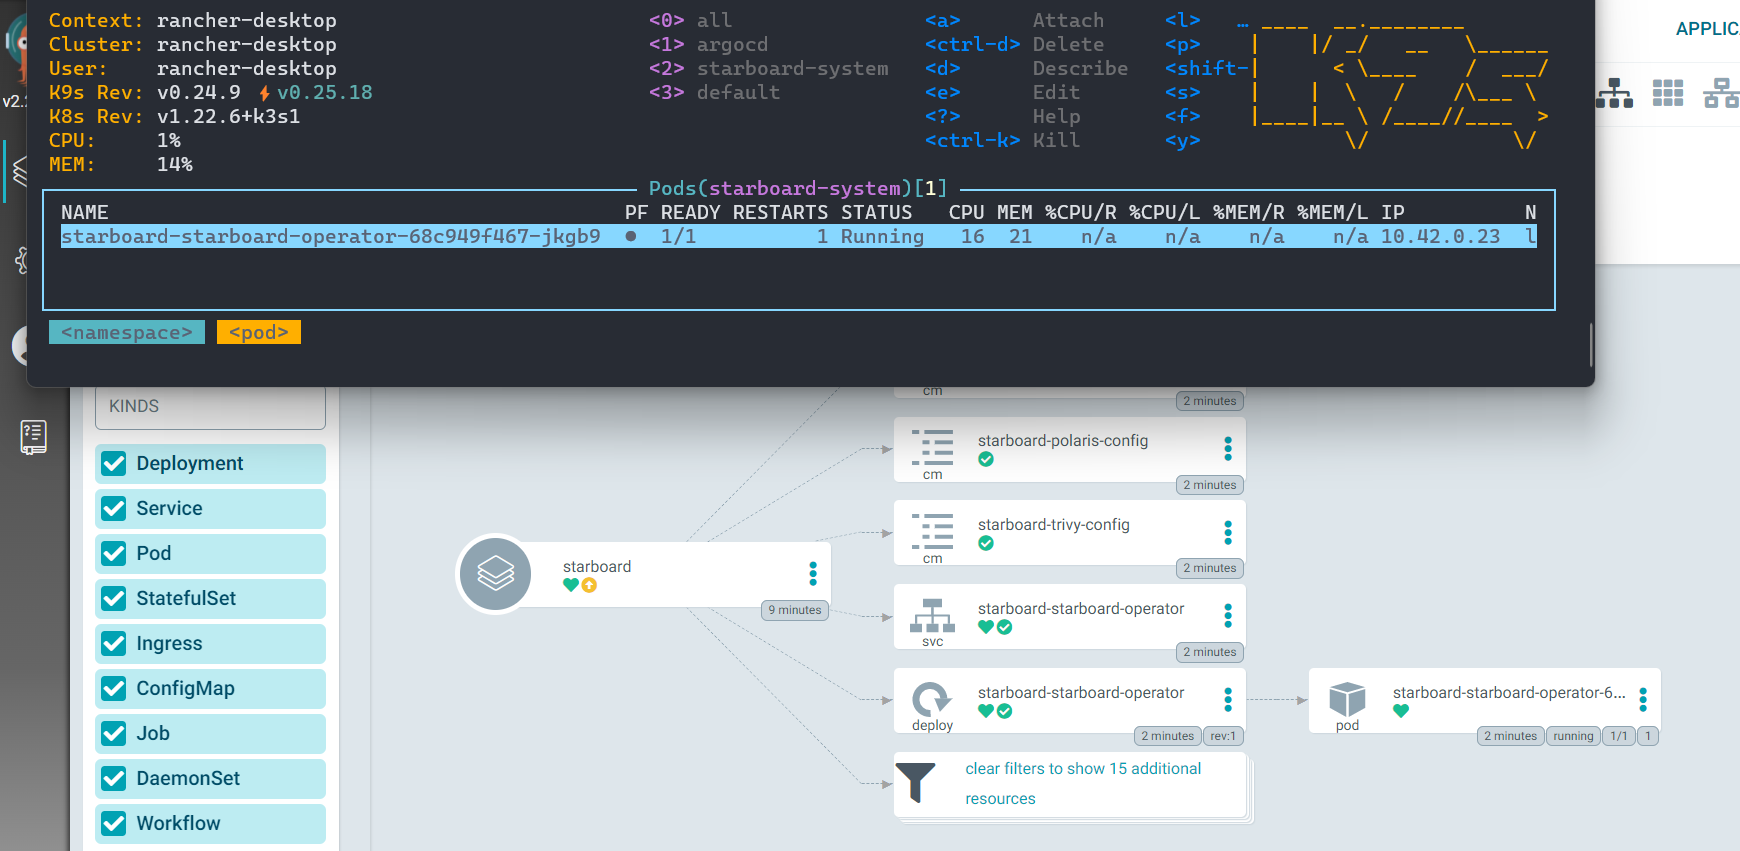
Check that everything is running properly in the starboard-system namespace:
kubectl get all -n starboard-system
Your app should appear synced then:
Once you want to change values of the Helm release, you can do so via specifying a values.yaml file:
targetNamespaces: ""
trivy.ignoreUnfixed: true
And then we will update ArgoCD:
argocd app set starboard --values starboard-values.yaml
Alternatively, you can specify the Helm values in the following section of our starboard-helm.yaml file:
helm:
      values: |
        targetNamespaces: app
Again, the latter option, changing values in the ArgoCD resource and pushing updates to Git would be the desired “GitOps” way.
Deploy an application and see Starboard in action
Once Starboard is installed, it will monitor the app namespace for vulnerabilities and misconfigurations. For instance, every pod of every deployment will be scanned automatically. Should any changes occur to that deployment, a new scan will be triggered.
We will deploy my react example application in the app namespace that we created at the very beginning of the tutorial. For this purpose, I have created another Application resource that we are going to give to ArgoCD.
We can deploy our app with the following command:
kubectl apply -n argocd -f https://raw.githubusercontent.com/AnaisUrlichs/argocd-starboard/main/app/app.yaml
Once ArgoCD knows about the application, we can make sure it is synced in the UI:
As you can see, besides our service and deployment, we have a VulnerabilityReport and a ConfigAuditReport that appeared in the ArgoCD UI:
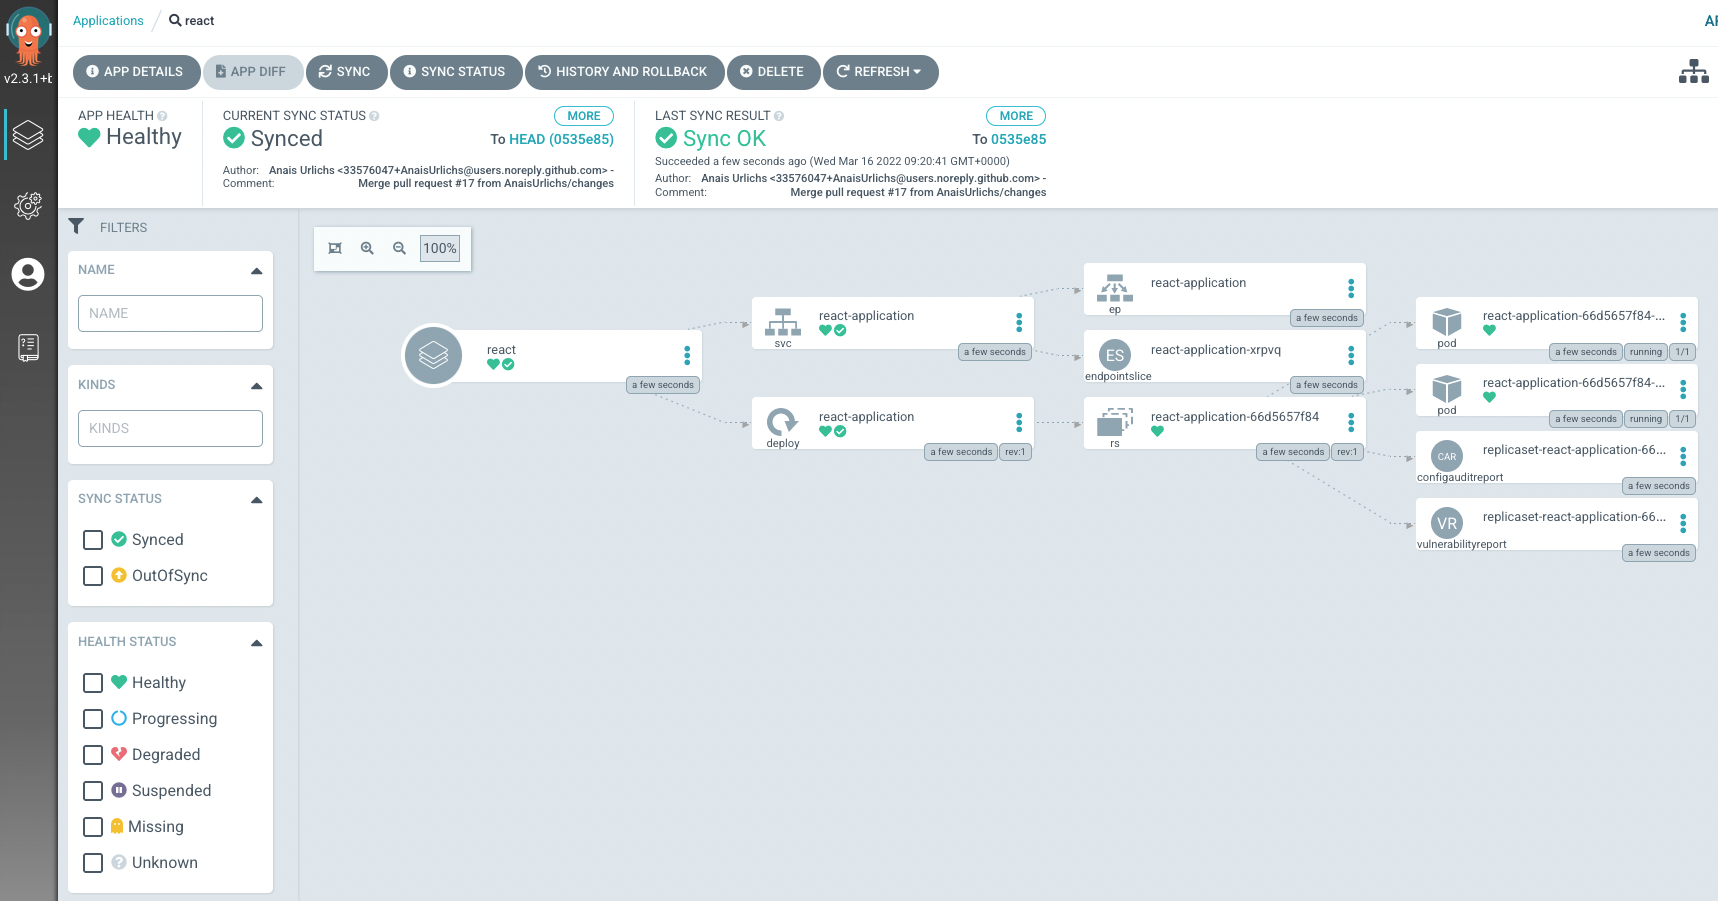
The VulnerabilityReport shows us all the Vulnerabilities of our container image, associated with our deployment.
Additionally, we can see the CIS Benchmark report inside of our Kubernetes cluster:
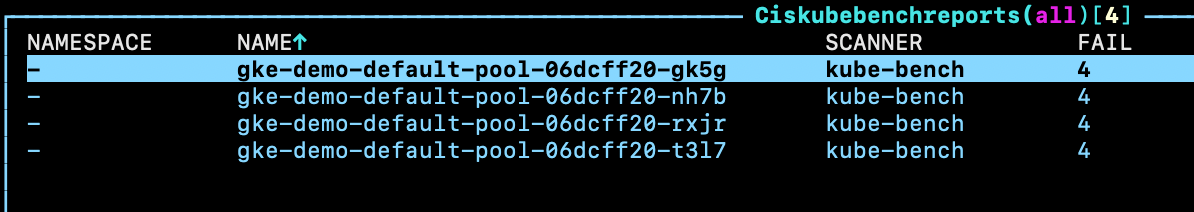
You can find further information on the different scans that Starboard triggers in the Starboard documentation.
Install Prometheus
Accessing the reports through ArgoCD and our cluster is great but it does not give us a good overview of the vulnerabilities that affect our workload nor can we get notified of new vulnerabilities.
To enhance the visibility of our Security reports, we want to install Prometheus and other monitoring tools inside of our Kubernetes cluster. Note that ArgoCD has a bit of a problem installing all the resources that are needed for Prometheus in the right order. Thus, we will install the CRDs first and make sure they are synced before we deploy the rest of the resources:
kubectl apply -n argocd -f https://raw.githubusercontent.com/AnaisUrlichs/argocd-starboard/main/monitoring/prom-crds.yamlBefore deploying the remaining Prometheus resources, make sure that the CRDs are synced:
argocd app sync crds
Note that you might have to verify with these CRDs that they are synced in the UI.
And then we are going to install the Prometheus resource:
kubectl apply -n argocd -f https://raw.githubusercontent.com/AnaisUrlichs/argocd-starboard/main/monitoring/prom.yamlAgain, you can find the YAML manifest that is given to ArgoCD inside the Git repository.
Make sure everything is synced through ArgoCD:
argocd app sync prometheus
Now check all the resources that got installed into the monitoring namespace:
kubectl get all -n monitoring
Note that you can edit Prometheus either by providing a values.yaml file to ArgoCD or by editing the Application resource.
We can access the Prometheus UI and the Grafana UI in separate terminals through the following commands:
Prometheus:
kubectl port-forward service/prometheus-kube-prometheus-prometheus -n monitoring 9090:9090
Grafana:
kubectl port-forward service/prometheus-grafana -n monitoring 5000:80
In most cases, you will need the log-in credentials for Grafana; by default, those are going to be:
- Username: admin
- Password: prom-operator
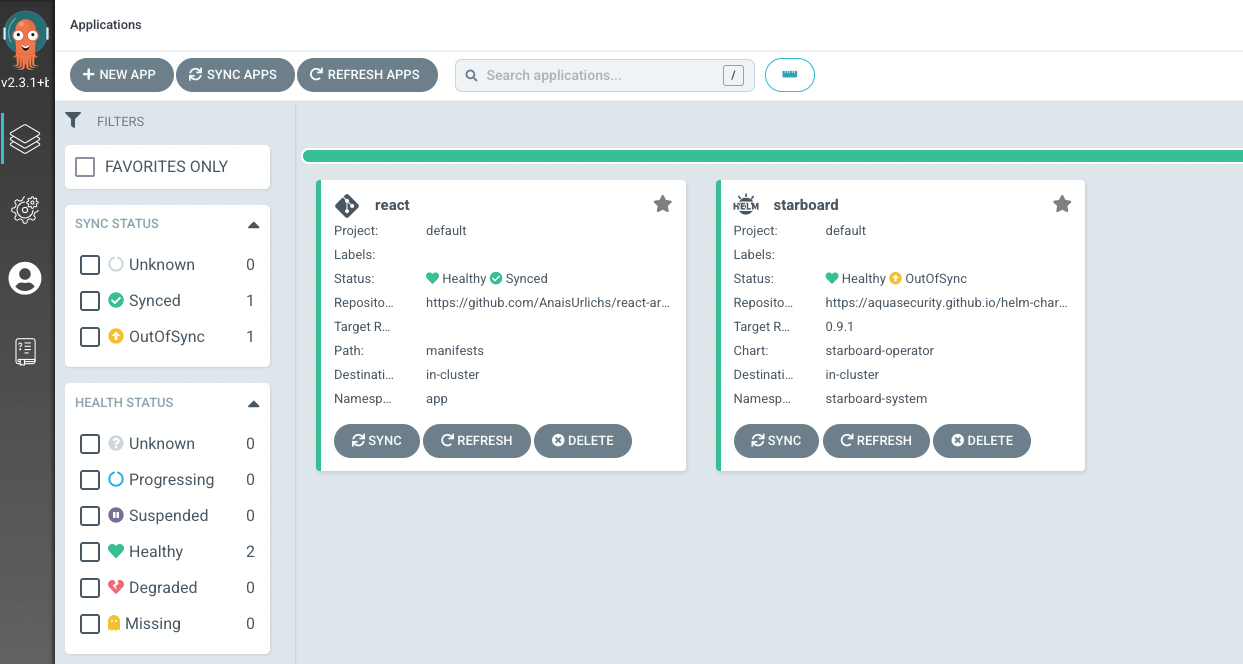
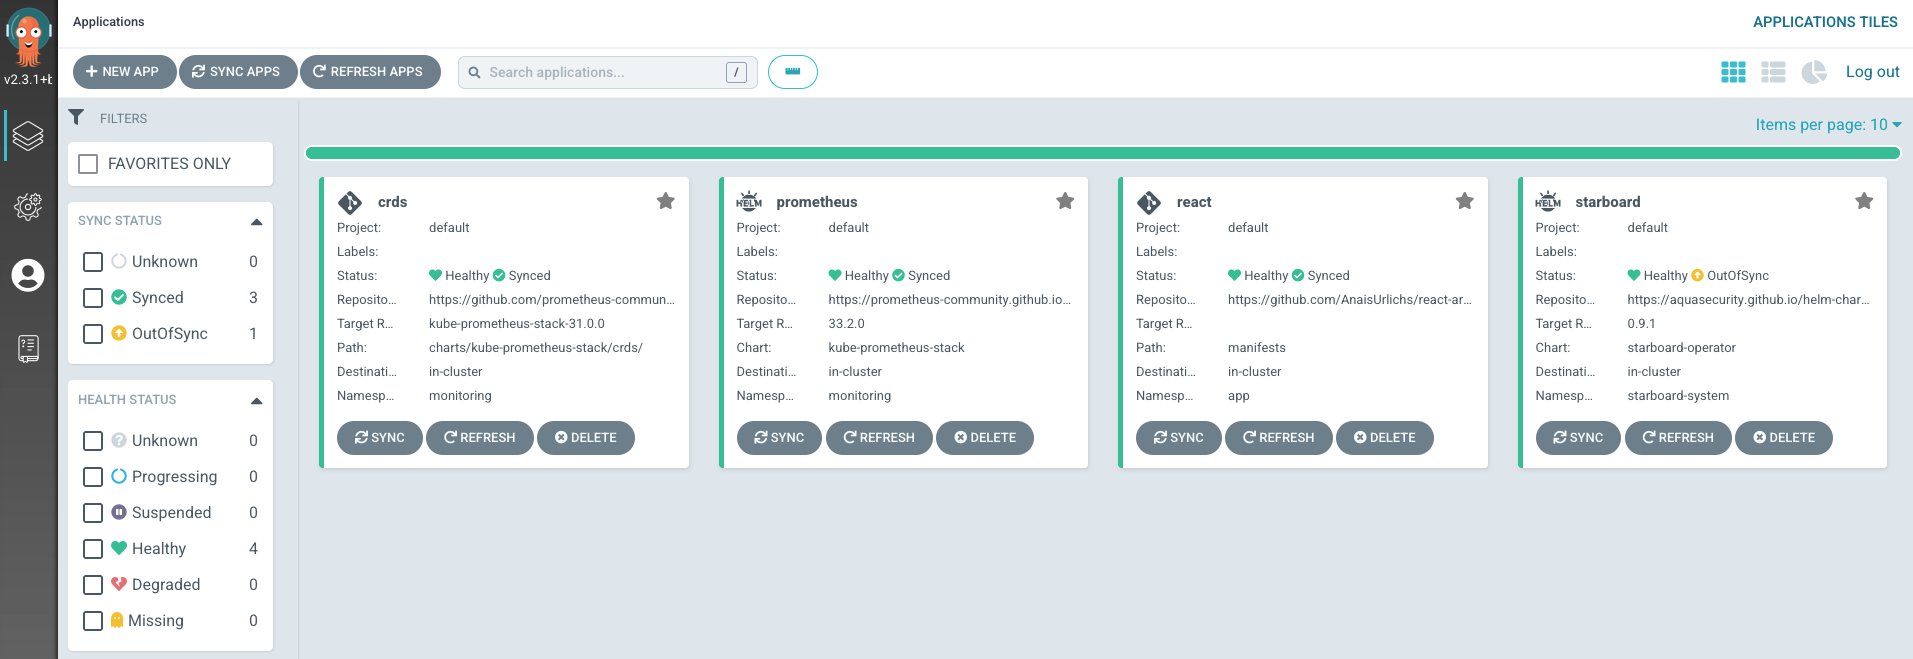
At this point, you should have the following applications deployed and managed through ArgoCD:
Starboard exporter
Now we have to make sure that Prometheus can discover Starboard and access the metrics of our VulnerabilityReports. This is done through a metrics exporter.
And, like before, we have specified how to deploy the Helm Chart through ArgoCD through a custom Kubernetes resource:
apiVersion: argoproj.io/v1alpha1
kind: Application
metadata:
  name: starboard-exporter
  namespace: argocd
spec:
  project: default
  source:
    chart: starboard-exporter
    repoURL: <https://giantswarm.github.io/giantswarm-catalog>
    targetRevision: 0.3.0
    helm:
      releaseName: starboard-exporter
  destination:
    server: <https://kubernetes.default.svc>
    namespace: starboard-system
In the same way that we told ArgoCD about the other resources, we are going to tell it about our Starboard Exporter:
kubectl apply -n argocd -f https://raw.githubusercontent.com/AnaisUrlichs/argocd-starboard/main/starboard/starboard-exporter.yaml
And again, make sure that the application is synced:
argocd app sync starboard-exporter
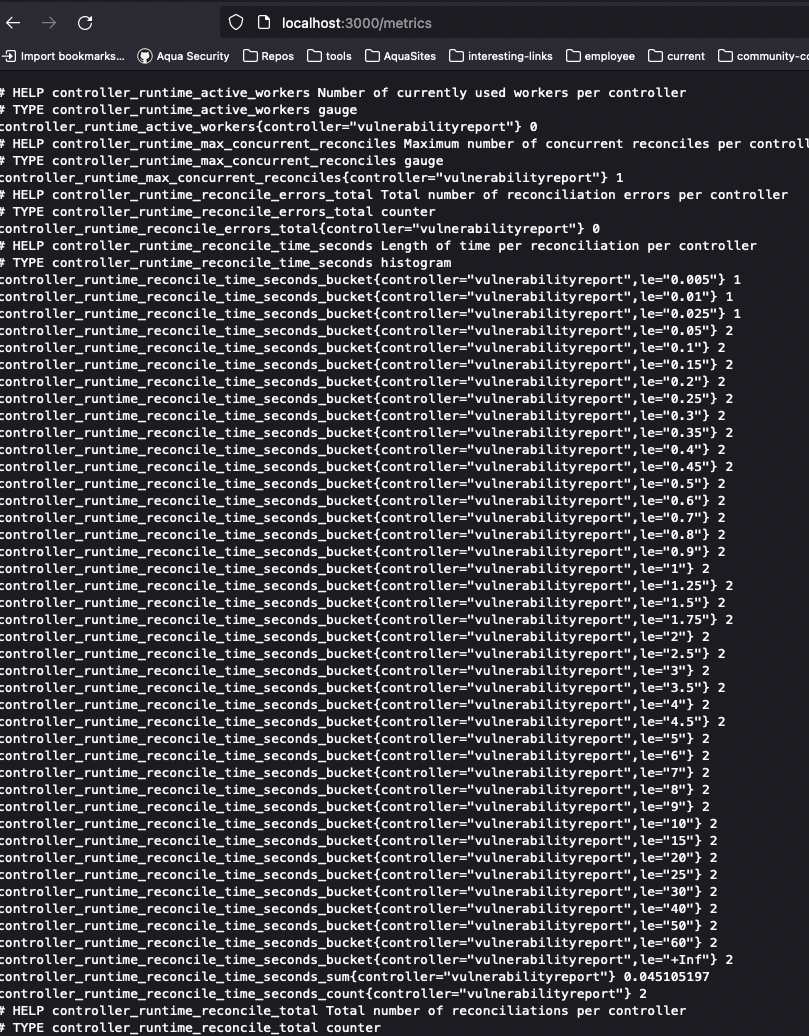
You can now port-forward the starboard exporter service to see the metrics that are being “spit-out” by it:
kubectl port-forward service/starboard-exporter -n starboard-system 3000:8080
Now check localhost:3000/metrics:
Opening up Prometheus (the port-forwarding from earlier), we can see our vulnerabilities:
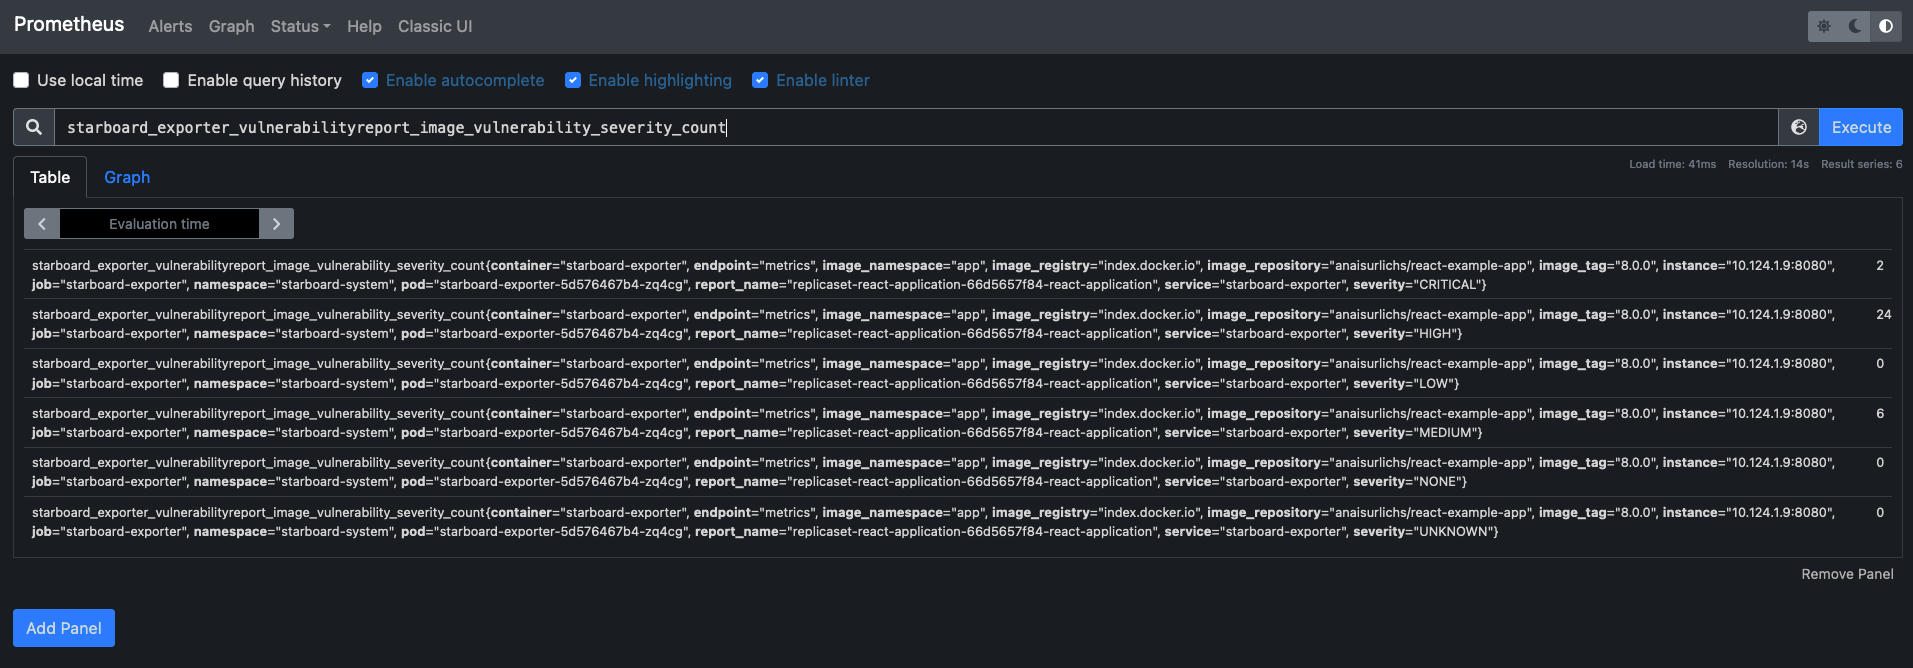
Look for the following metrics:
starboard_exporter_vulnerabilityreport_image_vulnerability_severity_count
What is next?
Now that we have everything set up to scan our workloads for vulnerabilities and access metrics through Prometheus, we can advance our setup. In the next tutorial, I am going to show you how to set up alerting through Alertmanager whenever a new vulnerability is found in your workloads. We are also going to create a Grafana Dashboard for our vulnerabilities.