Full Tutorial: K8sGPT -- SRE superpowers through AI
When you are using Kubernetes, you will run, sooner or later, into issues in your cluster that will require debugging and fixing so that your pods and services can operate as expected. Whether you are just getting started with Kubernetes or you are working with large-scale and more complex environments, debugging in-cluster processes is not always straightforward but can become a time-consuming and difficult task.
There are several debugging solutions available across the cloud native landscape that will help you to access in-cluster information. However, most of those don’t offer contextualized information.
In this blog post, I will introduce you to K8sGPT, the project to give Kubernetes Superpowers to everyone.

If you prefer the video version, you can find the full tutorial below:
Overview
K8sGPT started about 2 months ago, at the time of writing, by a group of experienced engineers in the cloud native ecosystem. It is a completely open source project that has already reached over 2.5 thousand stars on GitHub. The main idea behind K8sGPT is to utilise AI models to provide detailed and contextualised explanations of Kubernetes error messages among other cluster insights.
Furthermore, the project is already used by two organisations in production and has applied to become a CNCF sandbox project. Long term, the project is aiming towards building task-oriented machine learning models for Kubernetes.
The project already supports multiple installation options and different AI backends. In this blog post, I will show you how to install and get started with K8sGPT, both the CLI tools and the Operator as well as how K8sGPT supports additional integrations.
Installation
There are several installation options available depending on your preferences and Operating system. You can find the different options in the installation section of the documentation.
The prerequisite for installing K8sGPT as mentioned below is to have Homebrew installed either on your Mac or WSL on your Windows machine.
Next, you can run the following commands:
brew tap k8sgpt-ai/k8sgpt
brew install k8sgpt
To verify that K8sGPT is install correctly, you can check the version installed:
k8sgpt version
k8sgpt: 0.3.6 (9c0efe6), built at: unknown
K8sGPT CLI
Overview
To view all the commands provided by K8sGPT, used the `--help` flag:
k8sgpt --help
You can see an overview of the different commands also on the documentation.
Next, we will have to authorise an AI backend. In this video, we will use OpenAI.
Prerequisites
The prerequisites to follow the next sections is to have an OpneAI account and a running Kubernetes cluster; any cluster, such as microk8s or minikube will be sufficient.
Once you have the OpneAI account, you want to go to the following site to generate a new API key https://platform.openai.com/account/api-keys
Alternatively, you can run the following command and K8sGPT will open the same site in your default Browser:
k8sgpt generateThis key is needed for K8sGPT to interact with OpenAI. Authorise K8sGPT with the newly created API key/token:
k8sgpt auth add openai
Enter openai Key: openai added to the AI backend provider list
You can list your backends with the following command:
k8sgpt auth list

Default:
> openai
Active:
> openai
Unused:
> localai
> azureopenai
> noopai
Again, our documentation provides further information on the different AI backends available.
Next, we will install a malicious Deployment into our Kubernetes cluster. The pod will go into CrashLoopBackOff. Here is the YAML:
apiVersion: apps/v1
kind: Deployment
metadata:
  name: nginx-deployment
  labels:
    app: nginx
spec:
  replicas: 3
  selector:
    matchLabels:
      app: nginx
  template:
    metadata:
      labels:
        app: nginx
    spec:
      containers:
      - name: nginx
        image: nginx:1.14.2
        ports:
        - containerPort: 80
        securityContext:
          readOnlyRootFilesystem: true
Next, we will create a dedicated namespace for our example application and install the Deployment:
kubectl create ns demo
namespace/demo created
kubectl apply -f ./deployment.yaml -n demo
deployment.apps/nginx-deployment created
Now you will see the pods in our demo namespace throwing errors:
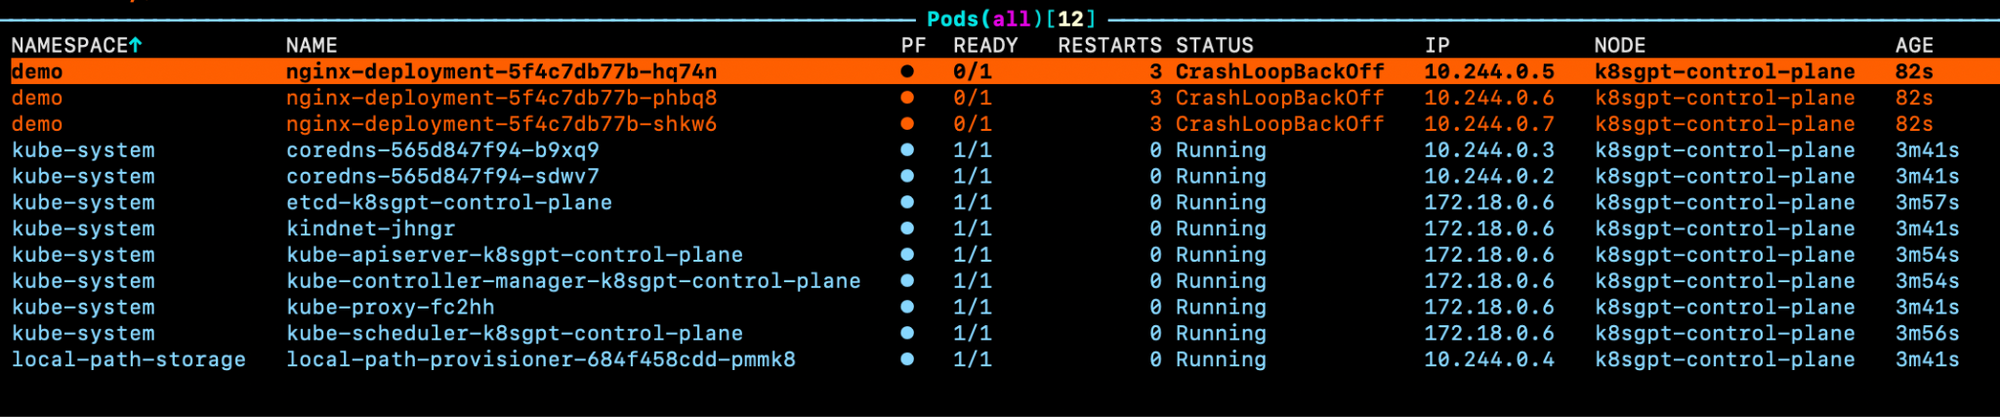
If we look at the events for one of the pods, we will not become much smarter:
Warning BackOff 3s (x8 over 87s) kubelet Back-off restarting failed containerSo what we can do instead to access more details on why these pods are erroring, we can run a K8sGPT command:
k8sgpt analyseThis will show us the problems that k8sGPT found inside our cluster:
AI Provider: openai

0 demo/nginx-deployment-5f4c7db77b-hq74n(Deployment/nginx-deployment)
- Error: back-off 1m20s restarting failed container=nginx pod=nginx-deployment-5f4c7db77b-hq74n_demo(7854b793-21b7-4f81-86e5-dbb4113f64f4)

1 demo/nginx-deployment-5f4c7db77b-phbq8(Deployment/nginx-deployment)
- Error: back-off 1m20s restarting failed container=nginx pod=nginx-deployment-5f4c7db77b-phbq8_demo(74038531-e362-45a6-a436-cf1a6ea46d8a)

2 demo/nginx-deployment-5f4c7db77b-shkw6(Deployment/nginx-deployment)
- Error: back-off 1m20s restarting failed container=nginx pod=nginx-deployment-5f4c7db77b-shkw6_demo(2603f332-3e1c-45da-8080-e34dd6d956ad)
To receive further information as well as recommendations on how to fix the issues, we can use the --explain flag:
k8sgpt analyse --explainAdditional features
Depending on your cluster size and the number of issues K8sGPT identified in your cluster, you can also filter by specific namespaces and types of workloads.
Furthermore, if you or your organisation is worried about OpenAI or other backends receiving sensitive information on your workloads, you can use the --anonymize.
Integration
The value of most tools in the cloud native ecosystem originates from how well they integrate with other tools.
At the time of writing, K8sGPT offers easy integration with observability tools, such as Gafana and Prometheus. Additionally, it is possible to write plugins for K8sGPT. The first plugin that was provided by the core maintainers is for Trivy, an all in one, cloud native security scanner.
You can list all available integration with the following command:
k8sgpt integration list
Active:
Unused:
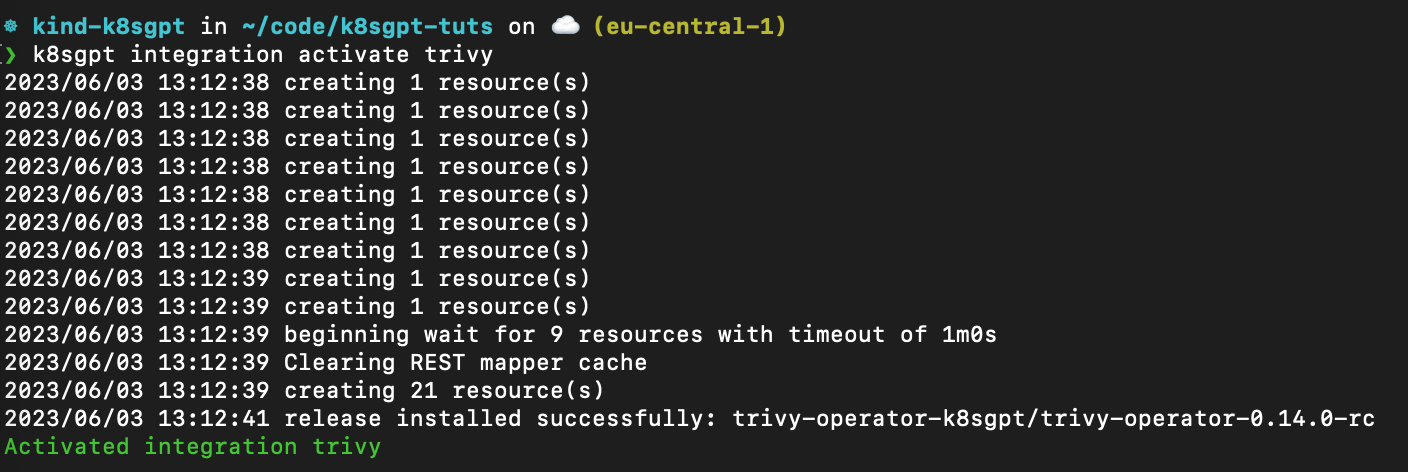
> trivyNext, we want to activate the Trivy integration:
k8sgpt integration activate trivyThis will install the Trivy Operator inside of your cluster (if not already installed):
Once the integration is activated, we can use the Vulnerability Reports created by Trivy as part of our K8sGPT analysis through k8sgpt filters:
❯ k8sgpt filters list
Active:
> Pod
> VulnerabilityReport (integration)
Unused:
> Deployment
> ReplicaSet
> Node
> Service
> Ingress
> StatefulSet
> CronJob
> PersistentVolumeClaim
> HorizontalPodAutoScaler
> PodDisruptionBudget
> NetworkPolicy
The filters correspond to specific analyzers in the k8sgpt code. Analysers only look at the relevant information e.g. the most critical vulnerabilities.
To use the VulnerabilityReport filter, use the following command:
k8sgpt analyse --filter=VulnerabilityReport
Similar to before, we can also ask K8sGPT to provide further explanations on the scan:
k8sgpt analyse --filter=VulnerabilityReport --explainK8sGPT Operator
Overview
While the CLI tool offers cluster-admins to perform ad-hoc scans on their infrastructure and workloards, the K8sGPT operator runs 24/7 in your cluster. It is Kubernetes native, meaning that it runs as Kubernetes Custom Resources and produces reports that are stored in your cluster as YAML manifests.
To install the Operator, follow the documentation or the commands provided below:
helm repo add k8sgpt https://charts.k8sgpt.ai/
helm repo update
helm install release k8sgpt/k8sgpt-operator -n k8sgpt-operator-system --create-namespace
If you would like to integrate K8sGPT with Prometheus and Grafana, you can use a slightly different installation by providing a values.yaml manifest to the installation above:
serviceMonitor:
	enabled: true

GrafanaDashboard:
	enabled: true
And then install the Operator or update your existing installation:
helm install release k8sgpt/k8sgpt-operator -n k8sgpt-operator-system --create-namespace --values values.yamlIn this case, we tell K8sGPT to also install a ServiceMonitor that will send metrics from scan reports to Prometheus and create a Dashboard for K8sGPT. If you have used this installation, you will also need to install the kube-prometheus-stack Helm Chart to access Grafana and Prometheus. This can be done with the following commands:
helm repo add prometheus-community https://prometheus-community.github.io/helm-charts

helm repo update

helm install prom prometheus-community/kube-prometheus-stack -n k8sgpt-operator-system --set prometheus.prometheusSpec.serviceMonitorSelectorNilUsesHelmValues=false
At this point, you should have both, the K8sGPT Operator and the Prometheus Stack Helm Chart (also a Kubernetes Operator) running inside your cluster.
Similar to how we needed to provide the CLI with our OpenAI API key, we will need to create a Kubernetes secret with our API key. For this, either use the same key as before or generate a new key on your OpenAI account.
To generate the Kubernetes secret, paste your OpenAI key into the following commands:
export OPENAI_TOKEN=<YOUR API KEY HERE>

kubectl create secret generic k8sgpt-sample-secret --from-literal=openai-api-key=$OPENAI_TOKEN -n k8sgpt-operator-system
Then, we need to configure the K8sGPT Operator to know which version of K8sGPT to use and which AI backend:
apiVersion: core.k8sgpt.ai/v1alpha1
kind: K8sGPT
metadata:
  name: k8sgpt-sample
spec:
  model: gpt-3.5-turbo
  backend: openai
  noCache: false
  version: v0.3.2
  enableAI: true
  secret:
    name: k8sgpt-sample-secret
    key: openai-api-key
Now, we need to apply this file to our K8sGPT cluster namespace:
kubectl apply -f k8sgpt-resource.yaml -n k8sgpt-operator-systemWith every new release of the Operator, you don’t need to modify the operator but simply the resource that is consumed by the Operator.
Within a few seconds, new results will be created from the operator:
kubectl get results -n k8sgpt-operator-systemBelow is a screenshot of the different commands that you can follow to access the result reports from the K8sGPT Operator:
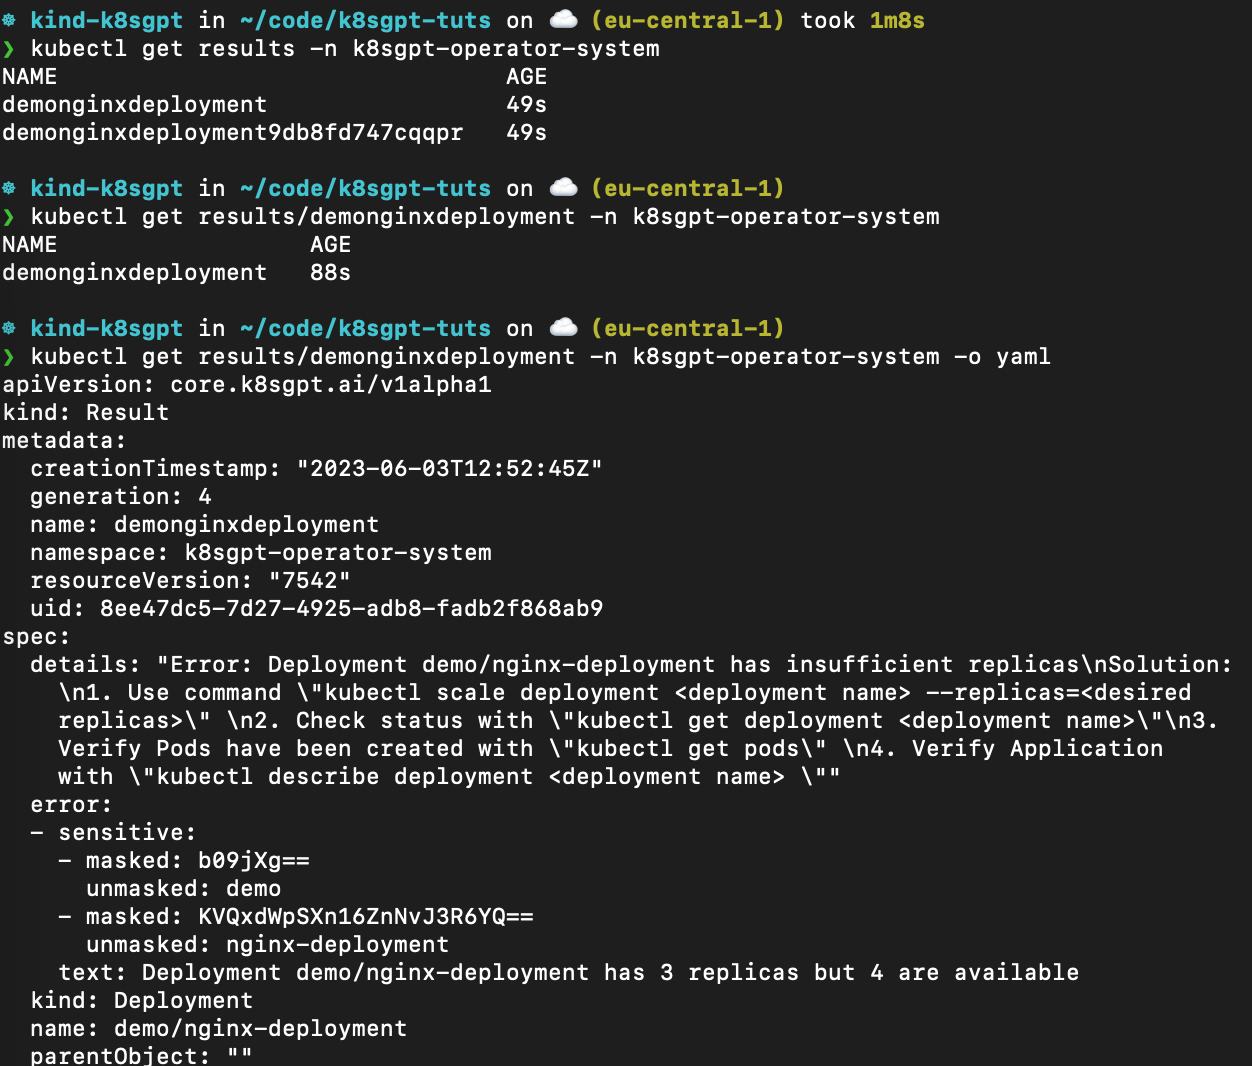
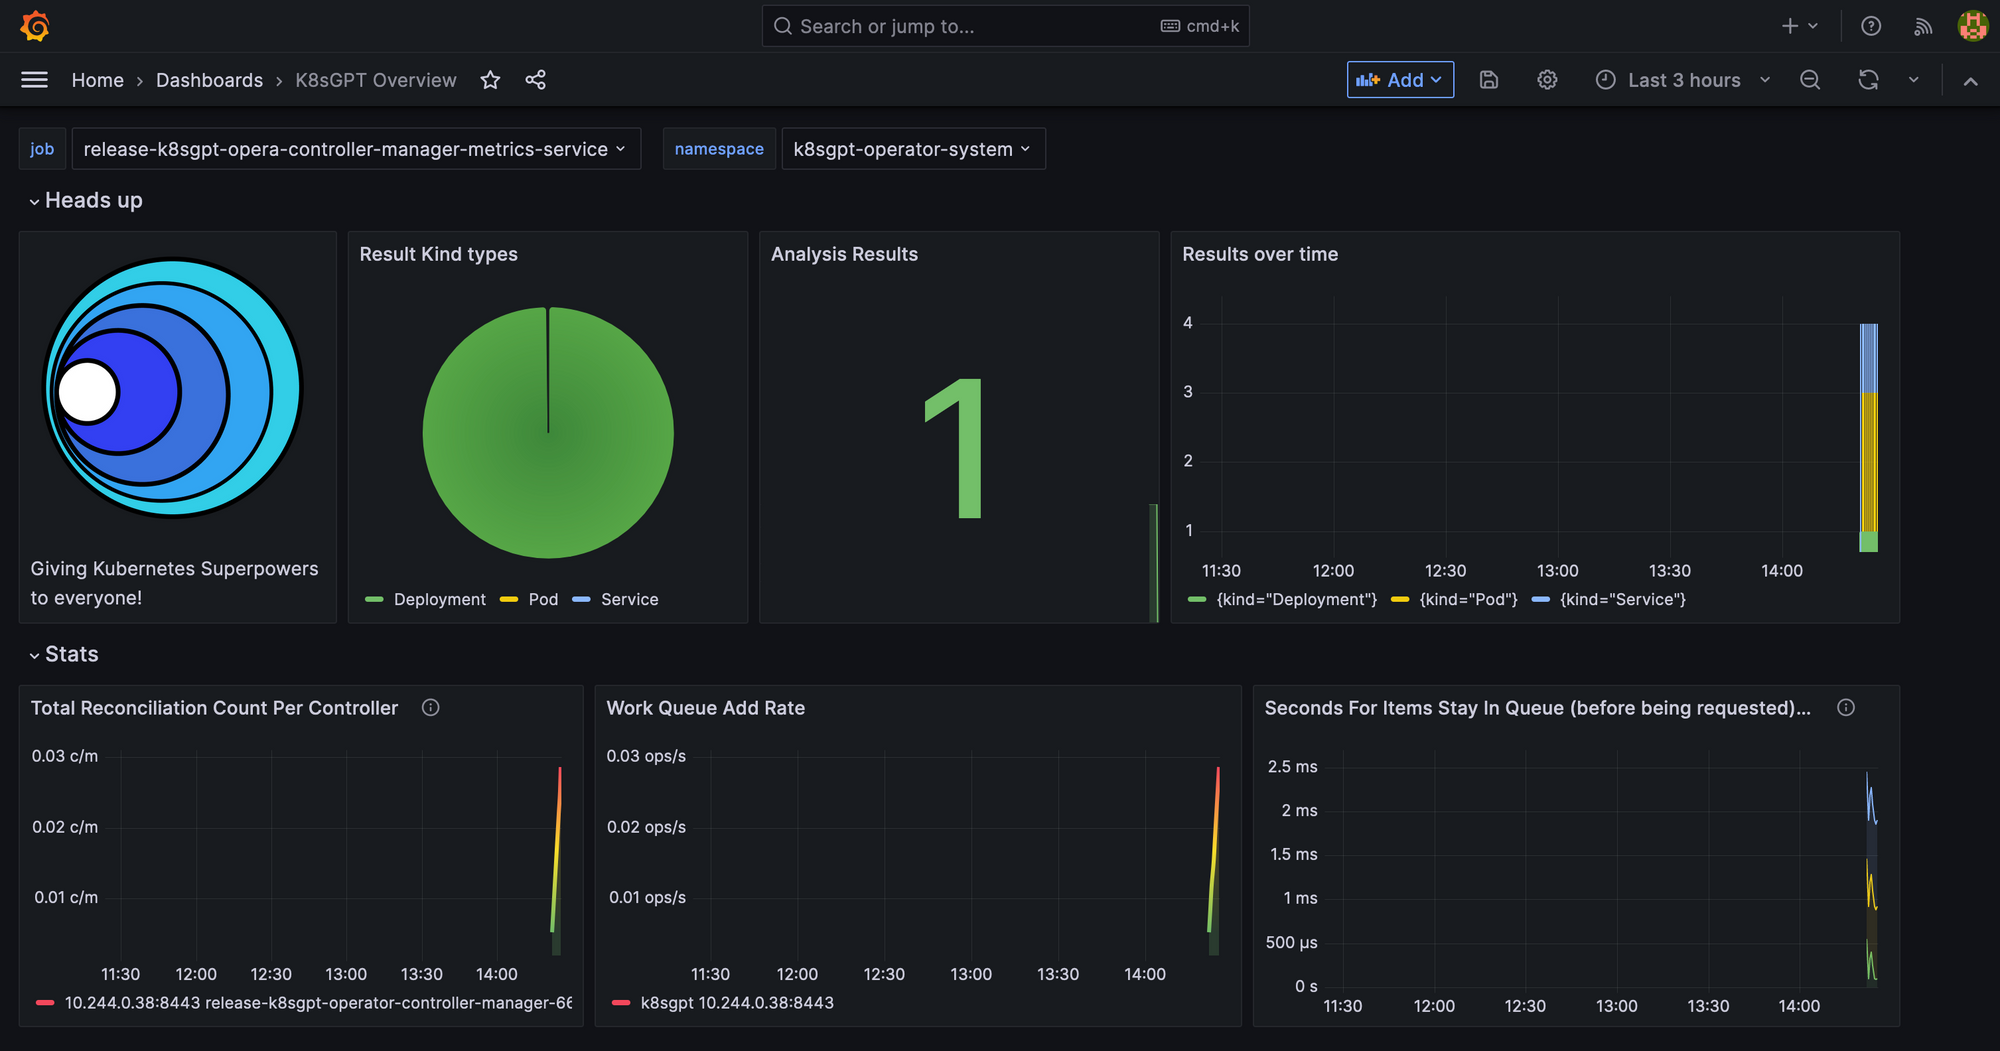
Lastly, we will take a look at the Grafana Dashboard. Port-forward the Grafana Service to access it through localhost:
kubectl port-forward service/prom-grafana -n prom 3000:80Open localhost:3000 and then navigate to Dashboards>K8sGPT Overview and then you will see the Dashboard with your results:
What’s next?
This blog post provided a full overview of the main capabilities of K8sGPT. We first took a look at the K8sGPT CLI, how K8sGPT is enhanced through integrations and then installed the operator for continuous, in-cluster analysis.
Do give K8sGPT a try and remember to give us a star on GitHub: https://github.com/k8sgpt-ai
Resources
Website: https://k8sgpt.ai/
Documentation: https://docs.k8sgpt.ai/
Slack
GitHub Organisation: https://github.com/k8sgpt-ai