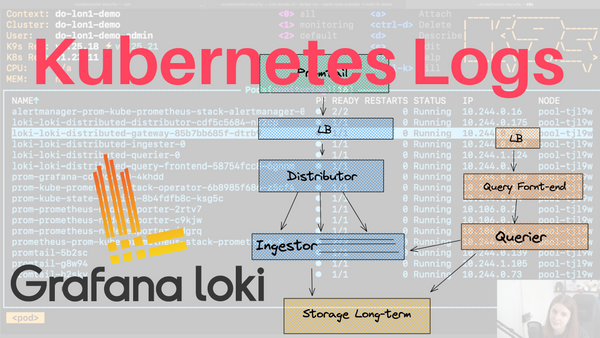
Most applications will generate logs & logs are a powerful troubleshooting medium in the cloud native space.
However, it is really time-consuming and cumbersome to query the logs of each Kubernetes resource individually through kubectl commands:
kubectl logs <name of application to get logs from>
This is where solutions such as Loki come in.
This blog post will provide:
- An overview of Loki and Loki components
- How to get started with Loki, Prometheus & Grafana
A lot of the content is based on a presentation I gave last year at ObservabilityCon with Alex Jones:
The slides for our talk can be found below or through the following link:
Video Recording:
Loki Overview
The following definition is taken from the Grafana website:
Loki is a horizontally scalable, highly available, multi-tenant log aggregation system inspired by Prometheus. It is designed to be very cost effective and easy to operate. It does not index the contents of the logs, but rather a set of labels for each log stream.
There is a lot to unpack in this paragraph. A system that is collecting logs has to be:
- Scalable: We don’t necessarily know how many logs an application will generate. Meaning that an application could generate few or lots of logs. If it’s the latter, we need a way to filter our logs.
- Multi-tenant: Collect logs across multiple environments
- Reliable: If the logs are used for debugging faulty processes, it is important to be able to access Logs whenever needed on the time span in which the errors occurred.
There are alternative applications and platforms for log aggregation. Many of those are proprietary or vendor-specific. In these cases, they do not integrate as smoothly with your existing cloud native tools. Other pitfalls of many systems include:
- They are challenging to operate at scale. Cloud native solutions are usually meant to be run in large-scale environments; they are widely adopted and other people have likely used them already.
- Difficult to correlate against metrics. If all your metrics are in Grafana, but your logs are in another tool, it will be complicated to correlate the logs against the metrics since they are in separate systems. In comparison, if all your data points are on the same platform, it becomes easier to connect them and identify patterns and similarities.
So how doe Loki work?
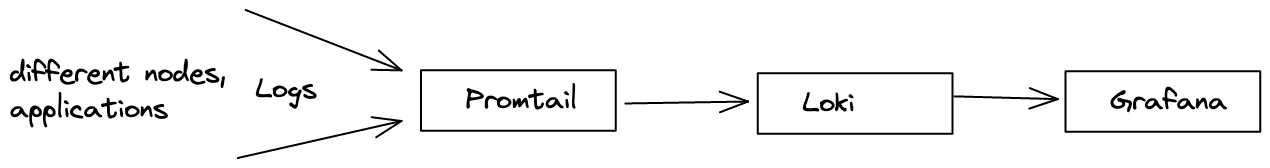
Loki has to be deployed with another system such as Promtail or Fluentd. These applications are responsible for collecting logs and forwarding them to Loki. Thus, both components, Loki and one of those applications must be deployed inside your Kubernetes cluster.
Promtail will run on each node of your cluster and monitor the applications for log. The logs are then collected and forwarded to Loki. Once Loki has access to the logs, you can connect to it in Grafana. Similar to how you can query Prometheus metrics with PromQL, you can query Logs with LogQL. We will look at this towards the end of our blog after we have deployed Loki.
Collecting Logs
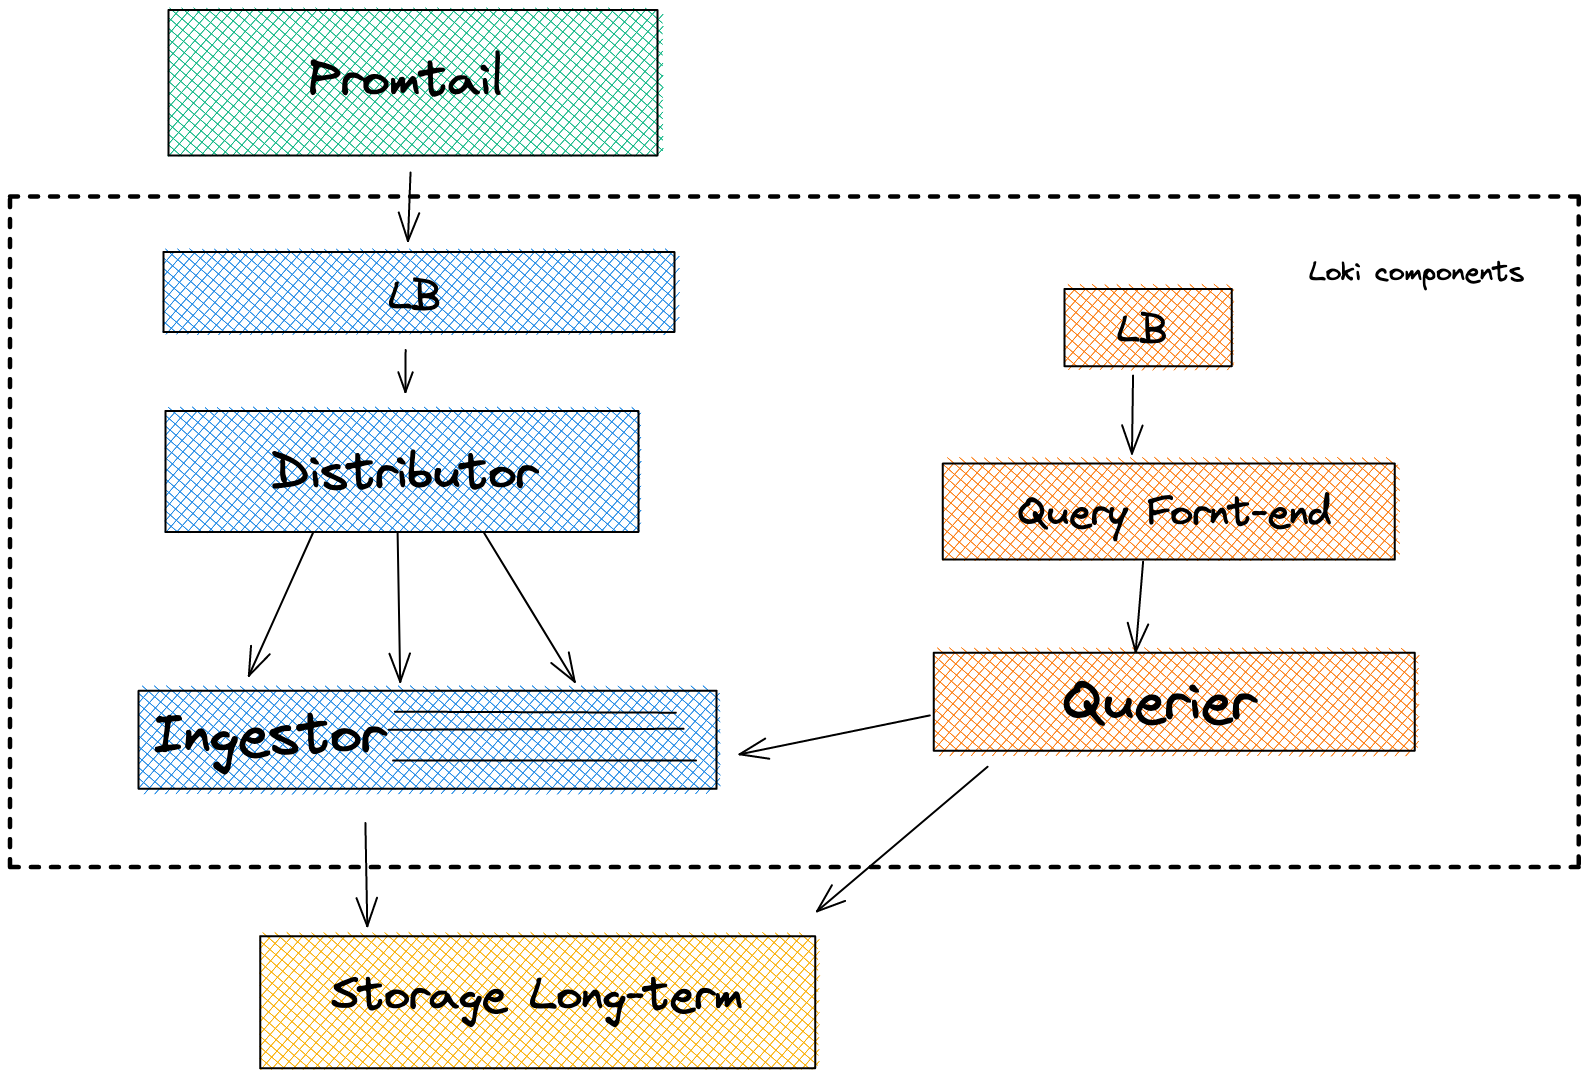
Below is a more detailed overview of the different components that Loki depends on. Promtail will forward the logs to a LoadBalancer. The Loadbalancer will then forward the logs to the Distributor. The Distributor’s main responsibility is to batch the logs and verify that they are valid. The valid chunks are then split into batches and forwarded to different Ingestors. Note that the Distributor is stateless which makes it easy to scale. The Distributor is ultimately responsible for taking work from the Ingestor. The Ingestor is the most critical component in Loki.
As part of the validation process, the Distributor checks that the log lines are not too long and that the timestamp is not too old.
The Ingestor will then receive a stream of logs and pack them up into Chunks. It is then responsible for forwarding the Chunks to long-term storage. You usually want multiple Ingestors running inside your Kubernetes cluster for higher availability.
Chunks are forwarded to long-term storage if
- The current chunk has reached capacity (a configurable value).
- Too much time has passed without the current chunk being updated
- A flush occurs — basically, a certain time has reached, and the logs are automatically forwarded.
Getting Started
In this example, we are going to deploy
- The kube-prometheus-stack Helm Chart
- Deploy Promtail
- Deploy Loki
- Deploy an application that generates logs
- View the logs in through Grafana and Loki
Like always, if you prefer the video content to this tutorial, below is the link:
In this tutorial, we will use the following GitHub repository:
 Cloud-Native-Security
Prerequisites:
Please make sure that you have
- a running Kubernetes cluster, it could be a local development cluster, and that you are connected to the cluster with kubectl
- the Helm CLI installed
to verify, please run the following commands:
kubectl get nodes

helm version
Deploying the kube-prometheus-stack Helm Chart
This Helm Chart is a collection of other Helm Charts and components. If you are new to Helm, have a look at my previous Helm tutorials:
Helm is basically a package manager for Kubernetes. Alongside Prometheus, the kube-prometheus-stack Helm chart deploys the following components:
First, we need to add the Helm Chart to our list of Helm Charts:
helm repo add prometheus-community https://prometheus-community.github.io/helm-charts
At this point, please also add the Grafana Helm Charts since those are going to be used later on:
helm repo add grafana https://grafana.github.io/helm-charts


helm repo update
Next, we want to create a monitoring namespace:
kubectl create ns monitoring
Before we deploy the Prometheus Stack Helm chart, we want to set up a prometheus-config.yaml file with the following content:
prometheus:
  prometheusSpec:
    serviceMonitorSelectorNilUsesHelmValues: false
    serviceMonitorSelector: {}
    serviceMonitorNamespaceSelector: {}

grafana:
  sidecar:
    datasources:
      defaultDatasourceEnabled: true
  additionalDataSources:
    - name: Loki
      type: loki
      url: http://loki-loki-distributed-query-frontend.monitoring:3100
💡 How do you know what to put into the values of a Helm Chart? Each Helm Chart will have a values.yaml file. If you go to the source code you can see the default configurations and usually, Helm Charts will provide comments that detail how to change the values: https://github.com/prometheus-community/helm-charts/blob/main/charts/kube-prometheus-stack/values.yaml
The config file already includes the configuration to add Loki as a data source in Grafana.
Next, we can install the Prometheus Stack Helm Chart with the following command:
helm upgrade --install prom prometheus-community/kube-prometheus-stack -n monitoring --values observability-conf/prom-values.yaml
Make sure that the components are running. I prefer using a tool called k9s but you can also use kubect directly:
kubectl get all -n monitoring
Next, we want to deploy Promtail to our cluster. Promtail will also require some configuration to know where Loki lives i.e. where Promtail should send the logs to. Our configuration file will have the following content:
config:
  serverPort: 8080
  clients:
    - url: http://loki-loki-distributed-gateway/loki/api/v1/push
And then we can go ahead and install Promtail:
helm upgrade --install promtail grafana/promtail -f observability-conf/promtail-values.yaml -n monitoring
Once Promtail is installed, ensure you have as many Pormtail pods running in your cluster as you have nodes. In my case, I have a 3 node Kubernetes cluster, and with that I need 3 Promtail pods:
❯ kubectl get daemonset/promtail -n monitoring
NAME       DESIRED   CURRENT   READY   UP-TO-DATE   AVAILABLE   NODE SELECTOR   AGE
promtail   3         3         3       3            3           <none>          36s
And lastly, we can install Loki inside of our Kubernetes cluster:
helm upgrade --install loki grafana/loki-distributed -n monitoring
The following kubectl command will show us the different components that are running as part of Loki:
kubectl get all -n monitoring
Deploying an application and viewing the logs
To view logs, we first need an application that generates logs. The following deployment will install Tracee in your Kubernetes cluster. Tracee is a runtime protection and forensic tool.
Here is the YAML manifest that we want to apply:
apiVersion: apps/v1
kind: DaemonSet
metadata:
  labels:
    app.kubernetes.io/name: tracee
    app.kubernetes.io/component: tracee
    app.kubernetes.io/part-of: tracee
  name: tracee
spec:
  selector:
    matchLabels:
      app.kubernetes.io/name: tracee
  template:
    metadata:
      labels:
        app.kubernetes.io/name: tracee
      name: tracee
    spec:
      containers:
      - name: tracee
        image: docker.io/aquasec/tracee:full
        imagePullPolicy: IfNotPresent
        args:
          - --webhook <http://tracee-webhook:2801> --webhook-template ./templates/rawjson.tmpl --webhook-content-type application/json
        env:
          - name: LIBBPFGO_OSRELEASE_FILE
            value: /etc/os-release-host
        securityContext:
          privileged: true
        volumeMounts:
        - name: tmp-tracee
          mountPath: /tmp/tracee
        - name: etc-os-release
          mountPath: /etc/os-release-host
          readOnly: true
        resources:
          limits:
            cpu: 500m
            memory: 300Mi
          requests:
            cpu: 350m
            memory: 50Mi
      tolerations:
        - effect: NoSchedule
          operator: Exists
        - effect: NoExecute
          operator: Exists
      volumes:
      - hostPath:
          path: /tmp/tracee
        name: tmp-tracee
      - hostPath:
          path: /etc/os-release
        name: etc-os-release
And with the following command, you can apply it:
kubectl apply -f observability-conf/tracee.yaml
Make sure that Tracee is installed and running in your cluster:
❯ kubectl get daemonset/tracee
NAME     DESIRED   CURRENT   READY   UP-TO-DATE   AVAILABLE   NODE SELECTOR   AGE
tracee   3         3         0       3            0           <none>          27s
Like Promtail, Tracee has to run as a Daemonset in each node.
Note that we are looking at future videos in more detail at ebpf and Tracee — subscribe to get notified!!
It will generate lots of logs on the processes within our cluster. We can query the logs manually through kubectl, but like detailed earlier in the blog post, this is a manual process that does not allow us to filter for different logs:
kubectl logs tracee-7h2sc
Next, we want to open Grafana to query logs through Loki there:
kubectl port-forward service/prom-grafana -n monitoring 3000:80
Open localhost:3000
The username is: admin
The password is: prom-operator
Navigate to Explore on the left panel and select Loki as your data source.
You should see a screen similar to the following:
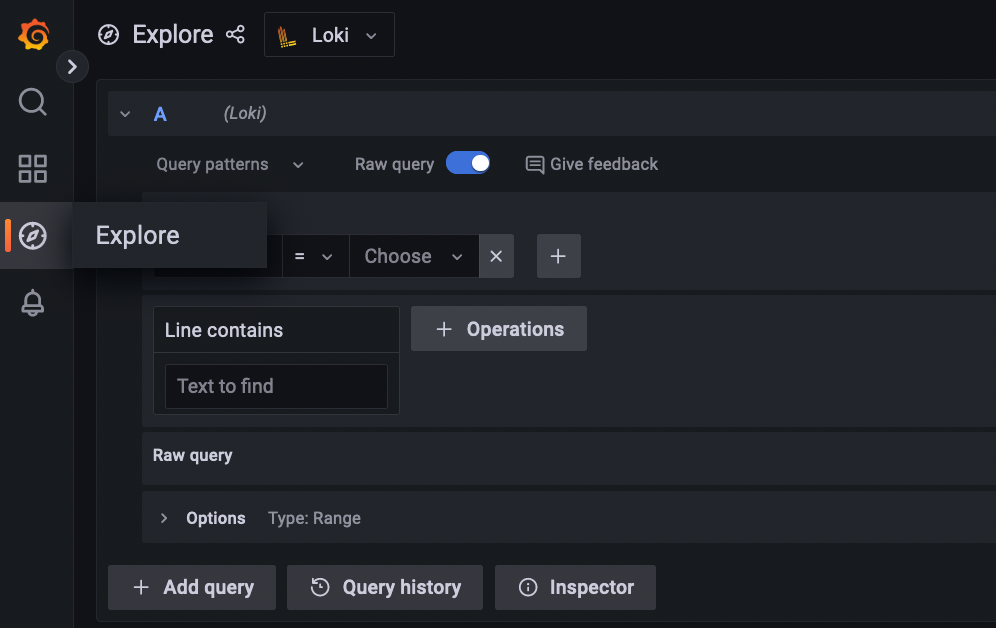
Next, we can play around with LogQL to query Tracee logs. Here are some example LogQL queries.
Again, we will dive into more detail about Tracee and what the logs mean in future videos.
What’s next?
Thank you so much for reading my blog post. I hope it was helpful. If you have any questions on Loki that I might be able to answer, please comment them in my YouTube video:
Alternatively, you could reach out on my contact form.
It would mean a lot to me if you could
Thank you ♥️