Security Scan Output Options and Output Plugins
Trivy is one of our open source projects at Aqua Security. It’s not only a very popular open source project with nearly 20.000 stars on GitHub but also a very versatile project. While most people use it for Vulnerability Scanning of container Images, this is just one functionality of many.
Trivy is composed of four different scanners. The Scanners include the following:
With each of these different scanners, users can scan different scan targets such as container images, configuration files, Kubernetes clusters or SBOMs, just to name a few.
Since Trivy is an open source project, it is focused on generating security scans. Users can perform any security scan, and Trivy will generate the scan output. It is then up to the user what they wish to do with the scan output.
In this blog post, I will show how to work with different security scan outputs, both in Trivy and the Trivy Kubernetes Operator, and use a new feature – the Trivy Output Plugin.
Trivy Scan Format and Output
In Trivy, every scan will produce one scan output. If one scan is highly similar to another one performed before, Trivy will use the previous scan result and might only modify the output displayed. Alternatively, if users have saved the scan output, they can use Trivy to convert it from one format to another. Examples are provided in this blog post.
The Trivy Documentation lists the supported report formats, including:
- Table
- JSON
- SARIF
- Template
- SBOM
- GitHub dependency snapshot
Note that we are focused on maintaining these output formats. However, if you want to add your format, you can now use the Output Plugin, which is explained later in this post.
Users can then specify the report format as part of the Trivy CLI command. For instance, the following command will scan Kubernetes YAML manifests for misconfiguration and output the report in JSON:
trivy config --format json ./bad_iac/kubernetes/Note that the commands use the following trivy-demo GitHub repository.
The output will look similar to the following:
❯ trivy config --format json ./bad_iac/kubernetes/
2024-01-03T13:29:50.638Z	INFO	Misconfiguration scanning is enabled
2024-01-03T13:29:51.268Z	INFO	Detected config files: 1
{
  "SchemaVersion": 2,
  "CreatedAt": "2024-01-03T13:29:51.268577Z",
  "ArtifactName": "bad_iac/kubernetes",
  "ArtifactType": "filesystem",
  "Metadata": {
    "ImageConfig": {
      "architecture": "",
      "created": "0001-01-01T00:00:00Z",
      "os": "",
      "rootfs": {
        "type": "",
        "diff_ids": null
      },
      "config": {}
    }
  },
  "Results": [
    {
Trivy Misconfiguration Scan
In this scan, the output will be displayed in the terminal. This is not the most practical experience, as users should not be expected to copy-paste the output in the terminal. Thus, it is possible to use the --output flag in combination with the file name to save the scan output to a specific file. An example is provided below:
trivy config --format json --output output.json ./bad_iac/kubernetes/This will store the scan output in an output.json file.
Converting Scans
To make it easier for users to move between different types of scan outputs, we have added the functionality to convert one scan output into another. This way, the user does not have to create another scan (even if the same scan would utilise the Trivy cache).
Let’s convert the output.json file from the previous command into a table display of the misconfigurations:
trivy convert --format table --severity CRITICAL,HIGH output.jsonFiltering scans
I will just quickly highlight how users can further filter the Trivy scan results. This is a different topic. Thus, if you would like to receive more information, check out the resources linked below.
There are multiple ways in which users can filter the scan output. For instance, in vulnerability scanning, a common filter displays just the vulnerabilities that already have a fix available or only displays the HIGH and CRITICAL vulnerabilities. Further examples are provided in the Trivy documentation and the YouTube video on the topic:
The following command provides an example:
trivy config --format json --output output.json --severity CRITICAL ./bad_iac/kubernetes/However, users can utilise multiple other filters to make the scan result more relevant to their use case, as shared in the documentation.
What to do with the Scan Output
At this stage, you will have an output file in your desired scan output. The next step is deciding what you want to do with the security scan output. As already mentioned, Trivy focuses on providing the security scan; it does not provide ways to manage the scan results. Users must set up this part themselves or pay an enterprise company like Aqua Security for a managed solution.
However, this section will provide some examples of what can be done with the Trivy scan output:
- If the scan output is in sarif format, it can be uploaded to the GitHub security tap, as detailed further below.
- Using Trivy to generate an SBOM, the SBOM of each container image can be added to your container registry. Once you perform another vulnerability scan of the container image, Trivy will try to access the SBOM first for a more efficient scan. Check out the following tutorial for SBOM vulnerability scanning: https://youtu.be/Kibk6qq7ZCs?si=nyK9hDtM3f5wJh8h
- Most companies automate security scans through their CI/CD pipeline; depending on the tool used, there are different ways to access and manage log output.
- Some companies might want to store scan results long term to analyse how the cluster evolved over time.
- Ideally, you want to integrate Trivy with your Developer and DevOps tooling. More information is shared in the next section.
Integrating Trivy Scans in your existing workflows
The Trivy documentation has an entire ecosystem page that lists the different tools that Trivy integrates with. For example, Trivy can be used through the VSCode Marketplace extension. This way, engineers can scan their development resources as they work with them.
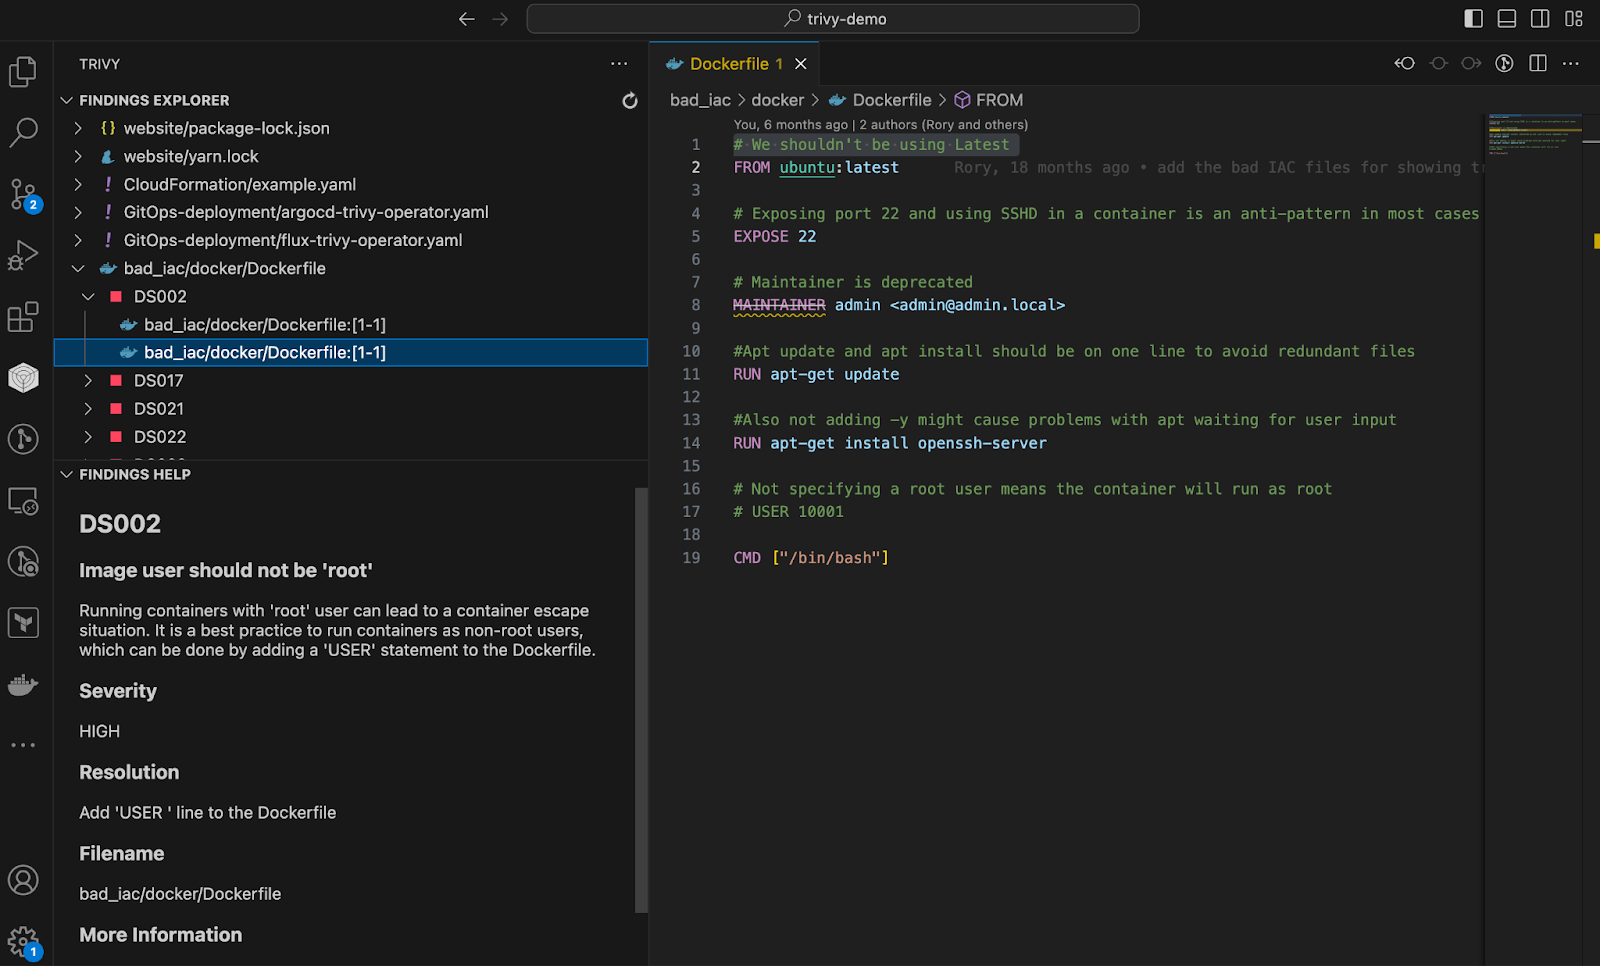
These may include the filesystem and application stack or configuration files. As part of a PR, engineers could be asked to upload the Trivy scan result for specific resources.
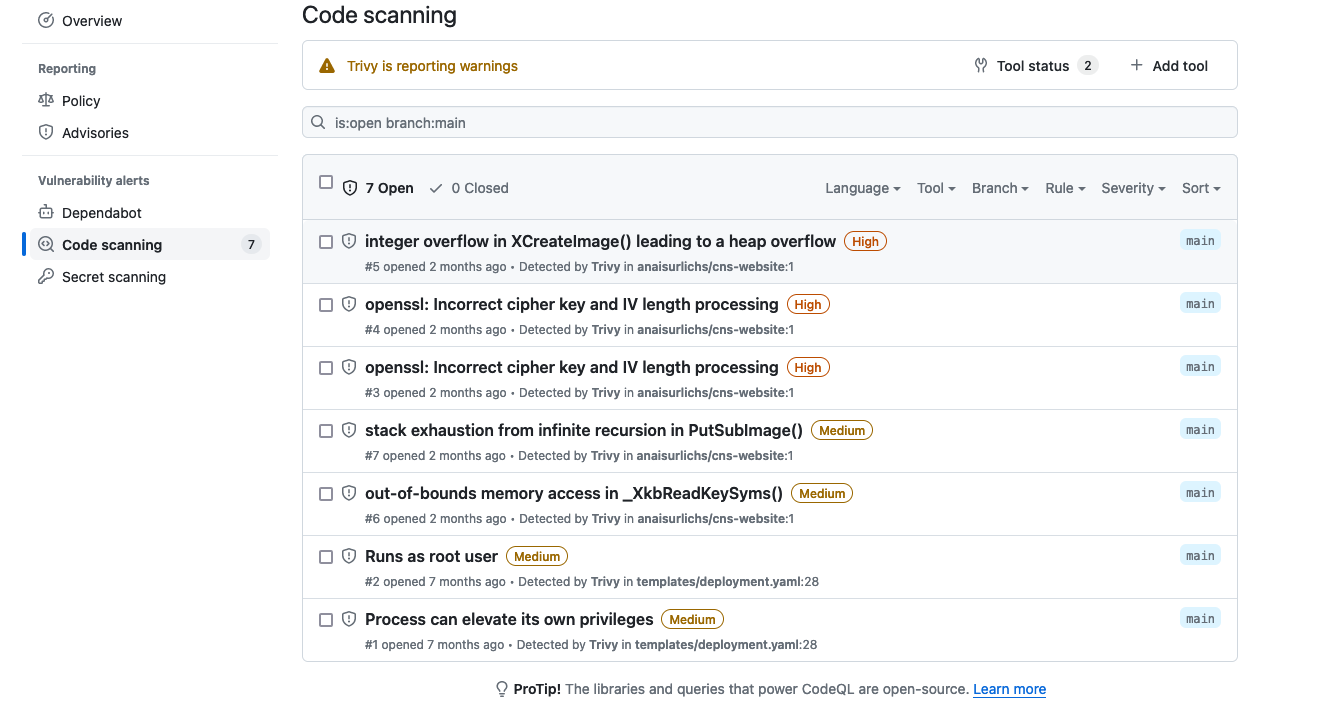
Upload Scan Output to the GitHub Security Tap
This section just provides a quick example of how the GitHub Security Tap can be used to upload and access scan Trivy scan reports.
First, we will define the scan and scan output through GitHub CI/CD pipeline – GitHub Actions. Examples can be found in the Trivy GitHub Action repository.
You can see the pipeline here.
Once the scan ran, we can head over to the GitHub security tap in the repository and view an output similar to the following:
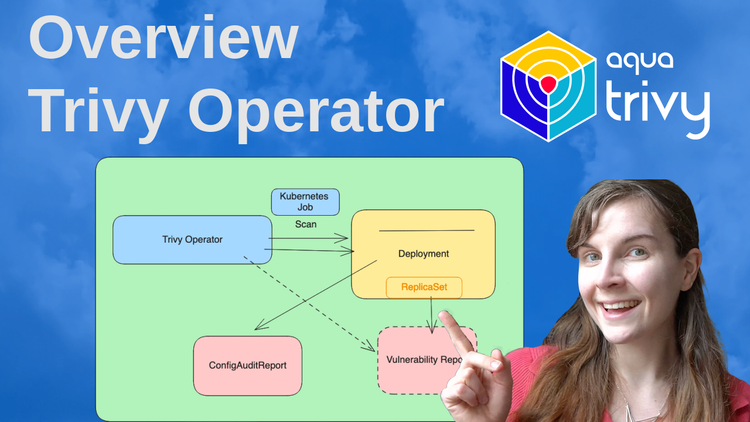
The Trivy Operator
While the Trivy CLI heavily relies on CI/CD pipelines to automate security scans, it is possible to integrate the Trivy Operator with other cloud-native tools. The Trivy Operator is a Kubernetes Operator that scans your Kubernetes cluster, infrastructure and running workloads for security issues.
Note that the Trivy Operator is not a replacement for the Trivy CLI. Both tools should be combined at different stages of your development lifecycle.
As part of the Trivy Operator documentation, we have a tutorial to showcase how to access security scan metrics through Prometheus and Grafana. Similarly, users can send notifications to Slack and other platforms as detailed in this tutorial, which is using AlertManager and Prometheus.
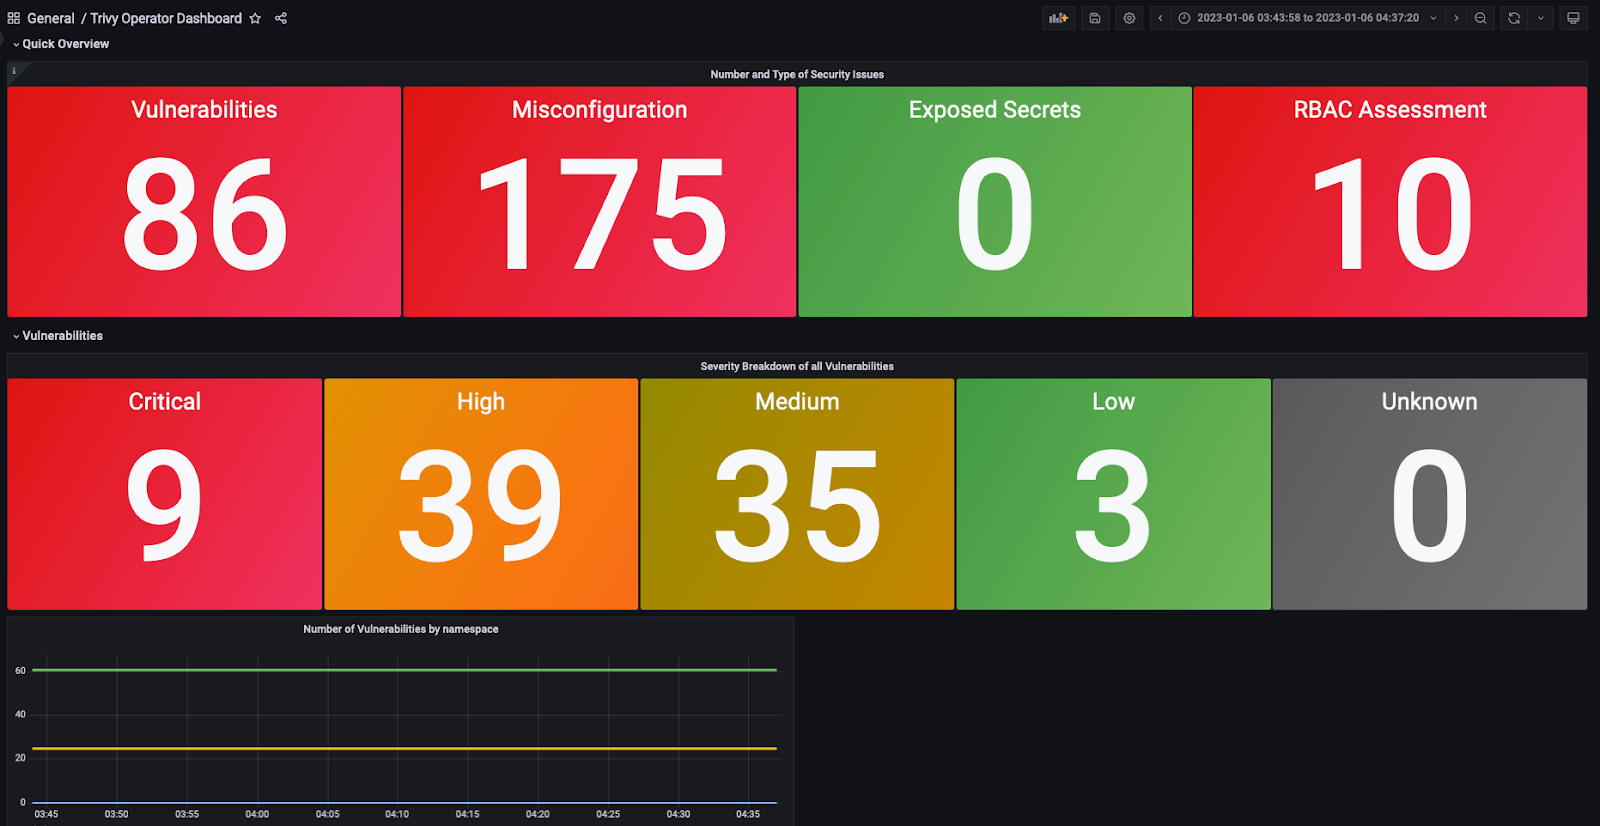
Since the Trivy Operator is a Kubernetes Native Operator, all scan results are stored in Kubernetes CRDs. This makes it possible to access scan results as metrics, and visualise them through Grafana and Prometheus or other tools.
The Trivy Output Plugin
Trivy has introduced a significant update with support for output plugins. This new feature allows for extended flexibility in handling Trivy's scan results. Users can now install custom output plugins and use them to format and process scan outputs in various ways.
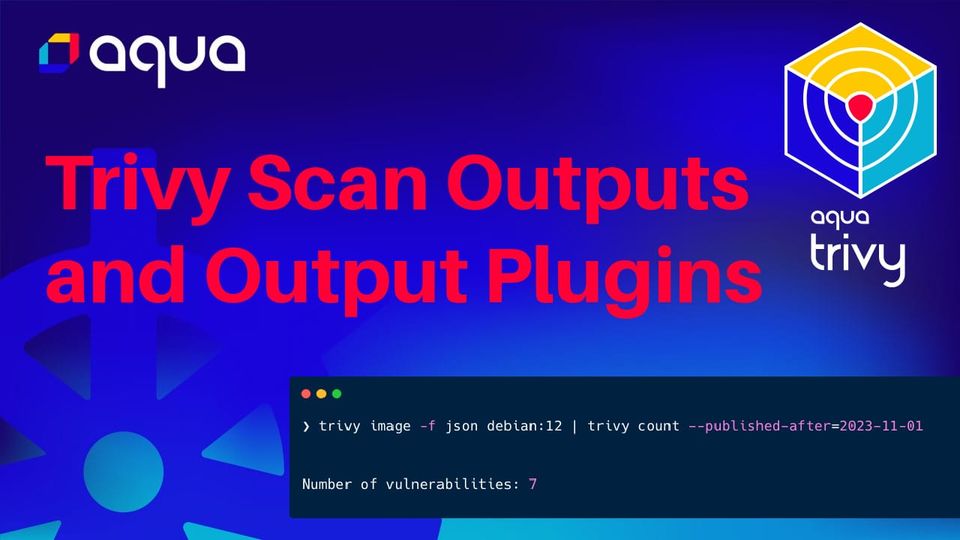
In the example below, we will use the `count` plugin.
First, we need to install the plugin to Trivy:
trivy plugin install github.com/aquasecurity/trivy-output-plugin-countThen we can perform a Trivy scan that uses the plugin:
trivy image -f json debian:12 | trivy count --published-after=2023-11-01You can read further about Trivy output plugins in the Trivy documentation.
What’s next?
In this blog post, we detailed how to generate different types of Trivy output reports, convert different types of reports, access reports from the Trivy Operator, and use the new output plugin functionality.
Trivy is a very versatile and comprehensive security scanner. If you would like to learn more about the features shared, we highly encourage you to check out the respective pages in the documentation.
If you liked this blog post, please give the YouTube video a like: https://youtu.be/rNPg7vyZ7zE
And maybe consider sharing this content on your social media. It would mean a lot to me.