Getting started with eBPF in Kubernetes - Tracee Installation Guide
Tracee is a Runtime Security and Forensics using eBPF technology to tap into your system and give you access to hundreds of events that help you understand how your system behaves. As part of its installation, it comes with hundreds of default events that help you identify malicious activity inside your Kubernetes cluster. In addition to the default events, it also has an advanced set of signatures that help you find more sophisticated attacks.
This blog post is part of a longer series in which we explore Tracee installation, use cases, and much more.
First off, we will look at how we can install Tracee through the Aqua Security Helm Chart.
The video for this blog:
Prerequisites
For the installation, we are going to use Helm. Helm is a package manager for Kubernetes similar to how npm is a package manager for node libraries. You can find more about Helm in the official documentation.
1. Ensure that Helm is installed in your terminal:
helm version
You should see an output similar to the following:
> version.BuildInfo{Version:"v3.9.1", GitCommit:"a7c043acb5ff905c261cfdc923a35776ba5e66e4", GitTreeState:"clean", GoVersion:"go1.17.5"}2. Next, you need access to a Kubernetes cluster that runs on Intel hardware. Basically, Apply M-series chips are not going to work for this example.
In my case, I use a one-node AKS Kubernetes cluster:
> kubectl get nodes
NAME                          	STATUS   ROLES   AGE   VERSION
aks-default-41077453-vmss000001   Ready	agent   17m   v1.26.3
Installing Tracee through Helm
Next, we will follow the Tracee documentation to install the Helm Chart. You can find the Helm Chart in the Tracee GitHub repository within the ./deploy directory.
All of the configurations for the Helm Chart are in the values.yaml manifest.
If you run the following Helm command, it will provide you with the YAML manifests of the Helm Chart (assuming that you cloned the GitHub repository and you are in the root directory):
helm templateThere are two installation options for the Helm Chart:
- Installing the Helm Chart from the cloned Tracee repository
- Installing the Helm Chart from the Aqua Security Chart registry
We recommend the second option as that makes it easier to manage the Helm Chart installation. Additionally, you might want to create a local values.yaml manifest that allows you to customize the Tracee Helm Chart.
To install the Tracee Helm Chart from the GitHub repository, use the following commands:
helm install tracee deploy/helm/tracee/ --namespace tracee-system --create-namespaceTo install the Tracee Helm Chart from the Helm Chart registry, use these three commands instead:
helm repo add aqua https://aquasecurity.github.io/helm-charts/
helm repo update
helm install tracee aqua/tracee --namespace tracee-system --create-namespace
Verify that the Tracee is installed and running correctly
Once you installed Tracee, you will have created a new namespace: the tracee-system namespace, inside your Kubernetes cluster.
Query all of the resources in the namespace to make sure that the Tracee pods are installed and running:
Kubectl get all -n tracee-system
NAME           	READY   STATUS	RESTARTS   AGE
pod/tracee-qtmjj   1/1 	Running   0      	18m

NAME                	DESIRED   CURRENT   READY   UP-TO-DATE   AVAILABLE   NODE SELECTOR   AGE
daemonset.apps/tracee   1     	1     	1   	1        	1       	<none>      	144m
Note that you should see as many pods as you have nodes in your Kubernetes cluster. For instance, if you are using a 3-node Kubernetes cluster, then Tracee should be running three pods, one pod for each and on each node.
Viewing Tracee Logs inside your Kubernetes cluster
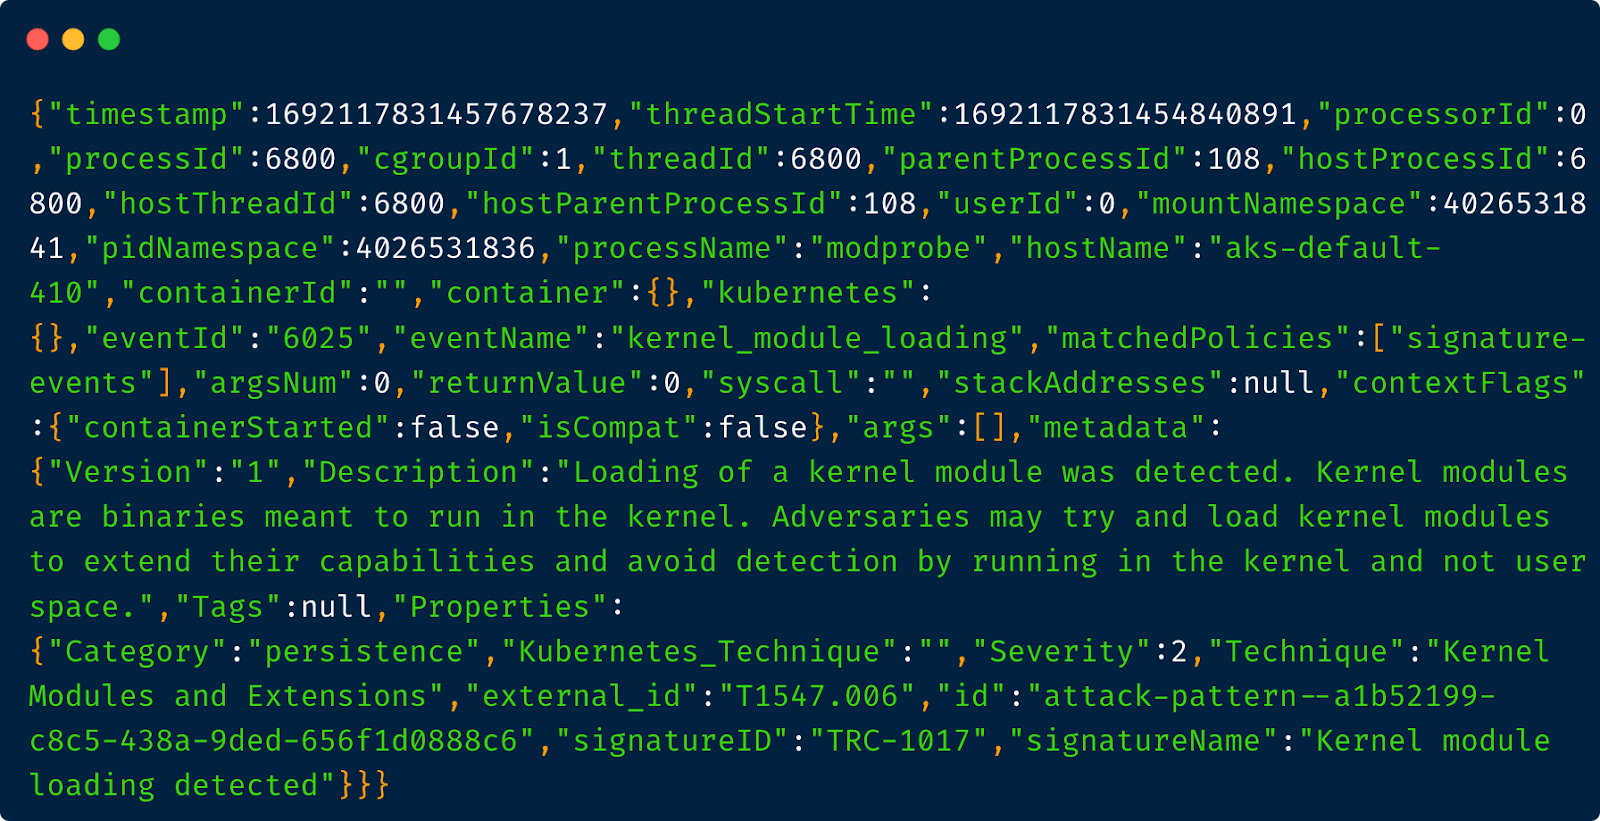
Query the logs of the Tracee DaemonSet to see whether Tracee already detected any malicious events:
kubectl logs -f daemonset/tracee -n tracee-systemTracee logs look similar to the following copy:
What’s next?
In the next blog post, we are going to look at Tracee Policies, specifically:
- What are Tracee Policies
- How to modify existing policies and set up a new policy
- How to track Trace-specific events through our Tracee Policy
If you enjoyed Tracee and want to learn more:
Subscribe to our Open Source YouTube Channel to be notified!